I talk to a lot of CFOs, and one thing we all have in common - we love real paper. I’m a sticky note guy. In a world gone digital, I’m still scribbling notes and to-dos like it’s 1999.
But one thing we all hate? Managing reimbursements that live on sticky notes, screenshots, or Slack threads. Even the “Did you get my receipt?” messages feel like chewing glass.
That’s why I like what Mercury’s doing. They believe business banking should do more… like making reimbursements actually tolerable. Their free expense reimbursement template lets your team track, submit, and approve expenses without the back-and-forth.
In a few minutes, your crew can log mileage, categorize receipts, and generate a clean PDF ready for approval. No login. No commitment. Just a smarter way to handle what used to be a spreadsheet mess.
*Mercury is a financial technology company, not a bank. Banking services provided through Choice Financial Group, Column N.A., and Evolve Bank & Trust; Members FDIC.
It’s Time for the Q3 Private Company Benchmarks
The best source for private company SaaS metrics

“Pre runs that third lap hard”
Anyone who’s ever tried to run a timed mile before knows that of the four laps, the third, not the first, is the farthest from the finish line.
The author John L. Parker captures this reality in my favorite book, Once a Runner:
“It was a long, cruel lap with no distinguishing feature save the fact that it had to be run. Every miler knows, in the way a sailor knows the middle of the ocean, that it is not the first lap but the third that is farthest from the finish line.
Races are won or lost here, records broken or forfeited to history, careers made or ended.
The third lap was a microcosm, not of life, but of the Bad Times, the times to be gotten through, the no-toys-at- Christmas, sittin'-at-the-bus-station- at-midnight blues times to look back on and try to laugh about or just forget.
The third lap was to be endured and endured and endured.”
For those operating companies on a four quarter cycle, the parallels are uncanny. You can substitute the word “lap” for “quarter” and it reads the same.
The third quarter has no distinguishing feature, save the fact that it has to be run. Yet, it’s where companies either maintain their momentum to close the year strong, or fall off pace and make the fourth quarter’s goal’s unattainable.
What better way to check progress than some benchmarking?
For those of you who missed it, here’s a link to Q2’s results (full PDF download for paying members).
What we cover
In each report, we span revenue, cost structure, and SaaS metrics. And do our best to filter by ARR band and deal size (ACV) when appropriate.
I. Sales Efficiency
ARR Growth by Stage
Retention (by ARR & ACV)
CAC Payback (by ARR & ACV)
Sales vs. Marketing Spend Mix
II. Staffing & Talent Strategy•
Headcount Growth by Stage
Department Mix
Revenue per Employee
III. Cost Structure & Efficiency
Gross Margin (by ARR & Company Type)
Spend as % of Revenue
Burn Multiple
Rule of 40
Got a metric you want to add? Just ask. Seriously. Reply back to this email.
How Submissions Work
While the output is robust, we’ve kept the submission form short—it takes ~4 minutes (seriously, it’s not gonna break your brain).
It’s literally 8 questions.
You’ll enter basic inputs.
And we’ll calculate all outputs and any compound metrics (like CAC Payback and Burn Multiple) for you.
Everything is anonymized. No company names. No sketchy tracking. Just signal.
For the first 25 readers who submit… I’d like to send you a ‘Run the Numbers’ Ciele branded running hat 🧢
Just reply back to this email with a screen shot of the survey’s “completed” screen and I’ll put one in the mail for you.

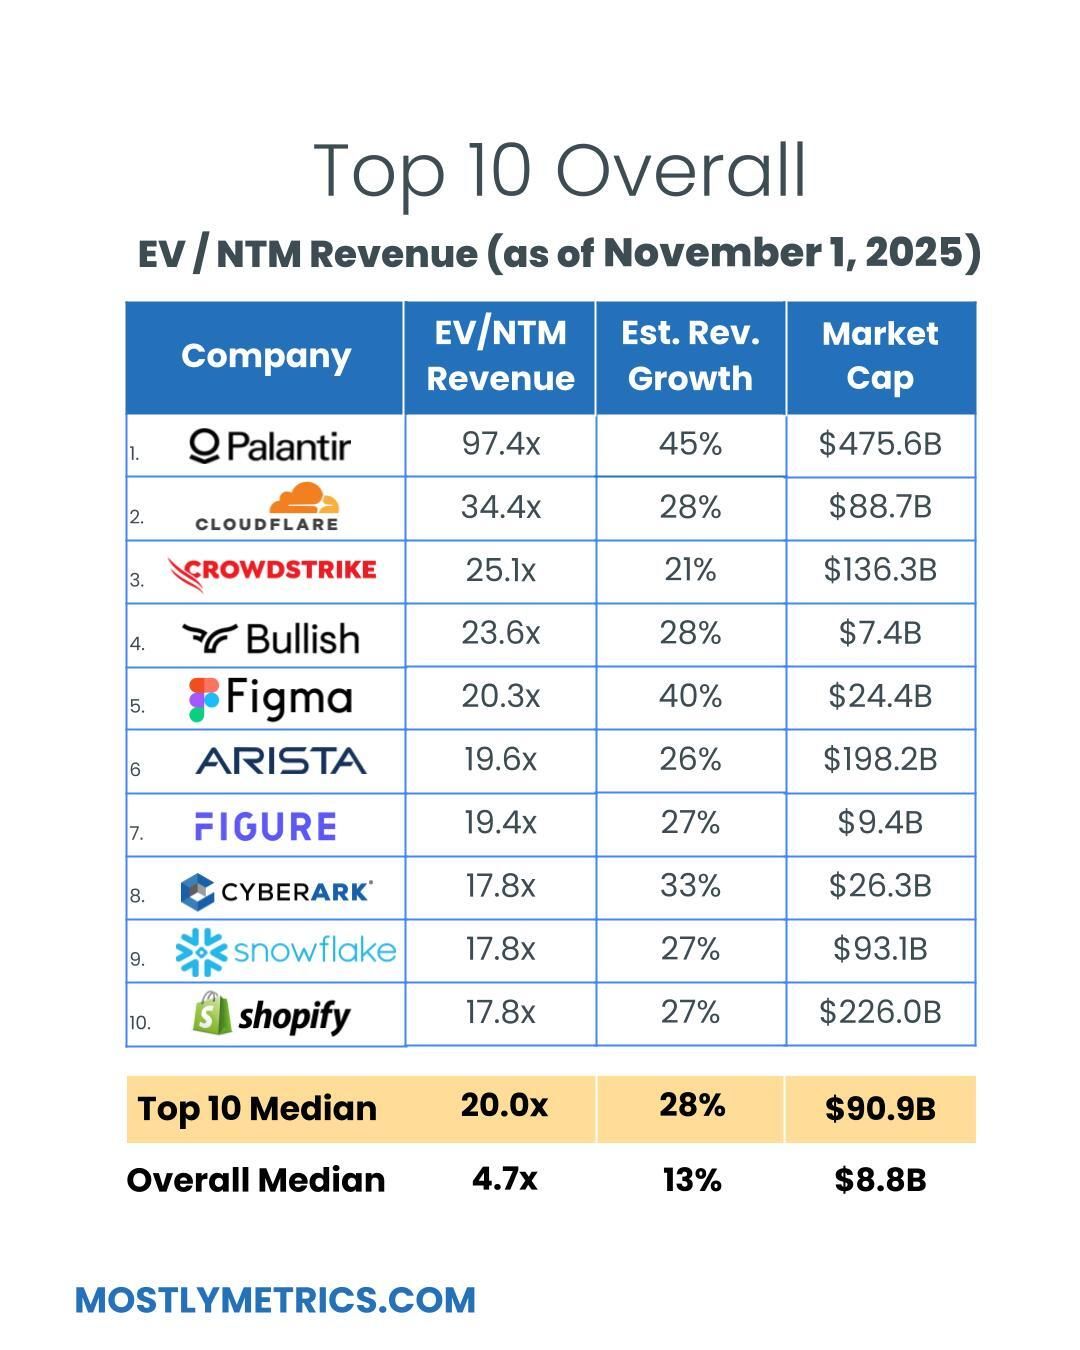
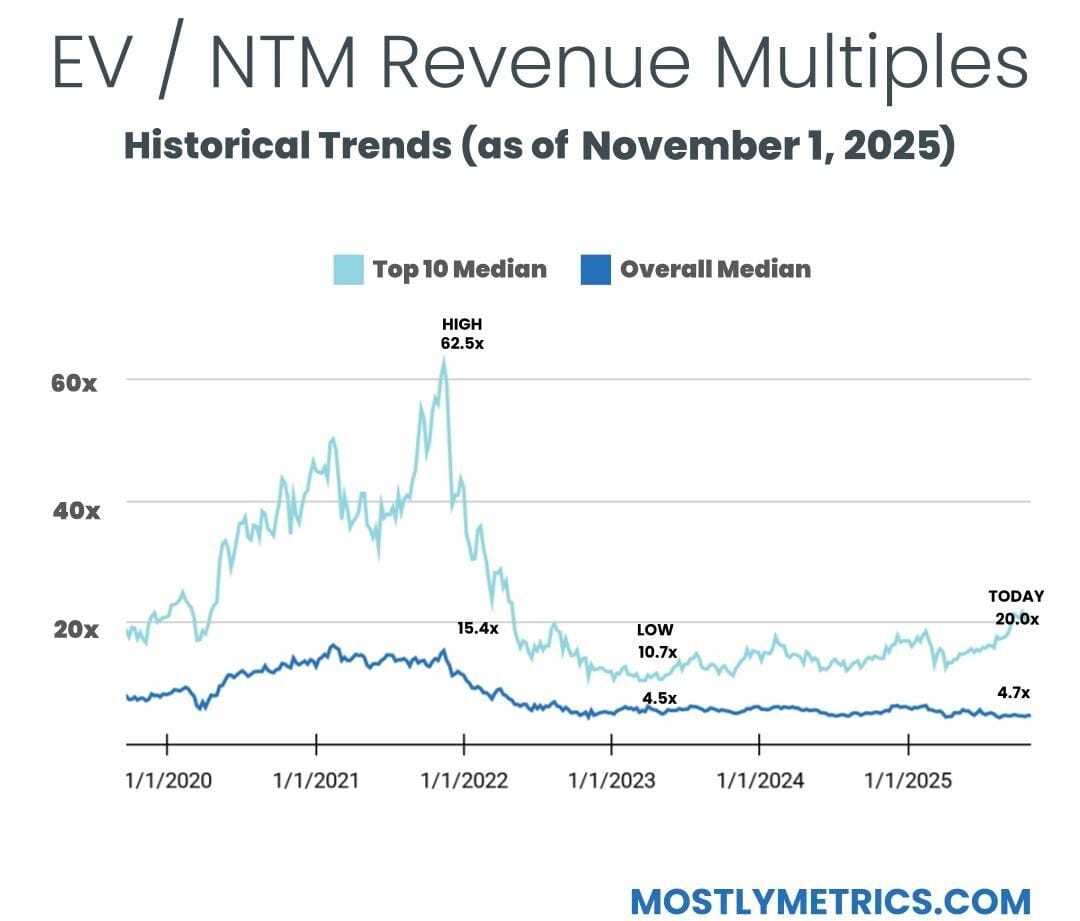
TL;DR: Multiples are UP week over week.
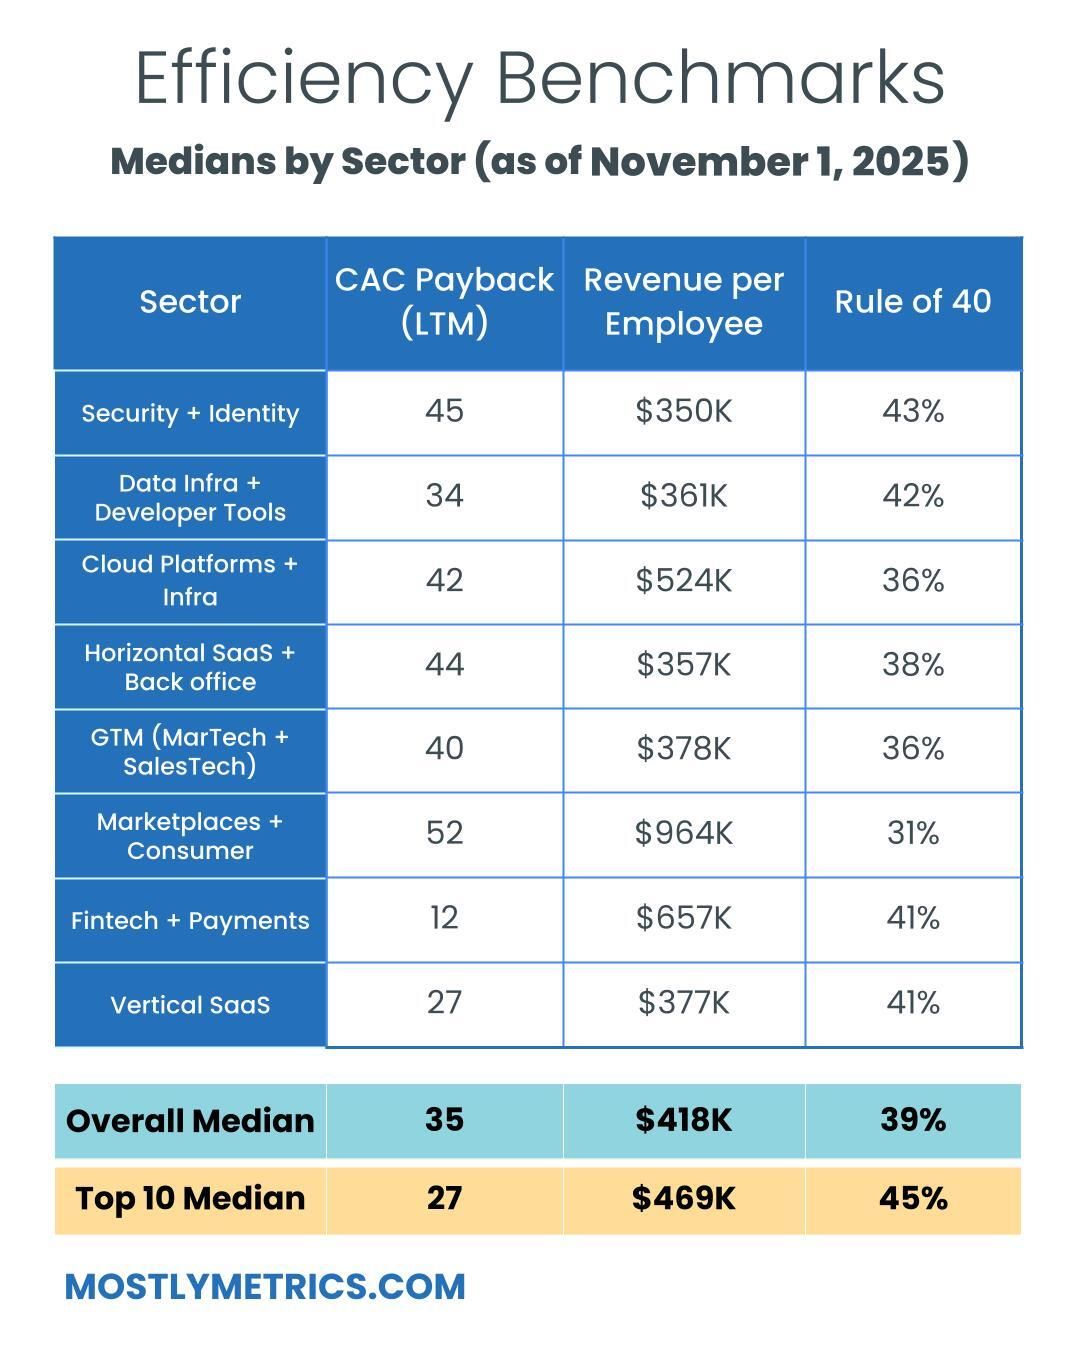
Top 10 Medians:
EV / NTM Revenue = 20.0x (DOWN 0.8x w/w)
CAC Payback = 27 months
Rule of 40 = 45%
Revenue per Employee = $469k
Figures for each index are measured at the Median
Median and Top 10 Median are measured across the entire data set, where n = 147
Recent changes
Added: Navan, Bullish, Figure, Gemini, Stubhub, Klarna
Removed: Olo, Couchbase
Population Sizes:
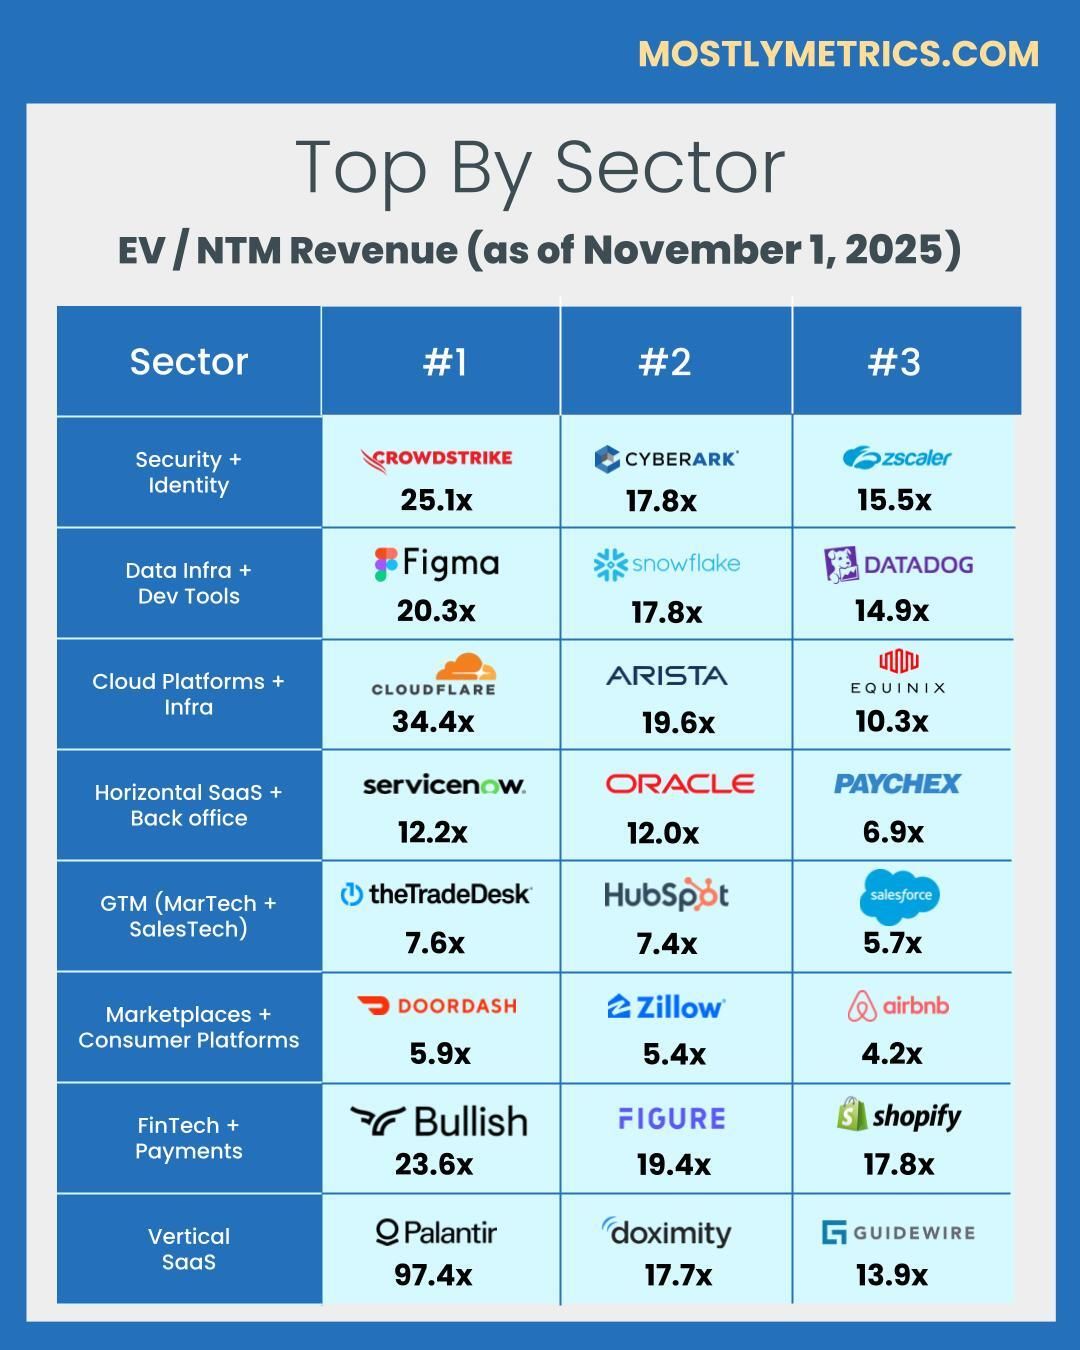
Security & Identity = 17
Data Infrastructure & Dev Tools = 13
Cloud Platforms & Infra = 15
Horizontal SaaS & Back office = 20
GTM (MarTech & SalesTech) = 19
Marketplaces & Consumer Platforms = 18
FinTech & Payments = 28
Vertical SaaS = 17
Revenue Multiples
Revenue multiples are a shortcut to compare valuations across the technology landscape, where companies may not yet be profitable. The most standard timeframe for revenue multiple comparison is on a “Next Twelve Months” (NTM Revenue) basis.
NTM is a generous cut, as it gives a company “credit” for a full “rolling” future year. It also puts all companies on equal footing, regardless of their fiscal year end and quarterly seasonality.
However, not all technology sectors or monetization strategies receive the same “credit” on their forward revenue, which operators should be aware of when they create comp sets for their own companies. That is why I break them out as separate “indexes”.
Reasons may include:
Recurring mix of revenue
Stickiness of revenue
Average contract size
Cost of revenue delivery
Criticality of solution
Total Addressable Market potential
From a macro perspective, multiples trend higher in low interest environments, and vice versa.
Multiples shown are calculated by taking the Enterprise Value / NTM revenue.
Enterprise Value is calculated as: Market Capitalization + Total Debt - Cash
Market Cap fluctuates with share price day to day, while Total Debt and Cash are taken from the most recent quarterly financial statements available. That’s why we share this report each week - to keep up with changes in the stock market, and to update for quarterly earnings reports when they drop.
Historically, a 10x NTM Revenue multiple has been viewed as a “premium” valuation reserved for the best of the best companies.
Efficiency
Companies that can do more with less tend to earn higher valuations.
Three of the most common and consistently publicly available metrics to measure efficiency include:
CAC Payback Period: How many months does it take to recoup the cost of acquiring a customer?
CAC Payback Period is measured as Sales and Marketing costs divided by Revenue Additions, and adjusted by Gross Margin.
Here’s how I do it:
Sales and Marketing costs are measured on a TTM basis, but lagged by one quarter (so you skip a quarter, then sum the trailing four quarters of costs). This timeframe smooths for seasonality and recognizes the lead time required to generate pipeline.
Revenue is measured as the year-on-year change in the most recent quarter’s sales (so for Q2 of 2024 you’d subtract out Q2 of 2023’s revenue to get the increase), and then multiplied by four to arrive at an annualized revenue increase (e.g., ARR Additions).
Gross margin is taken as a % from the most recent quarter (e.g., 82%) to represent the current cost to serve a customer
Revenue per Employee: On a per head basis, how much in sales does the company generate each year? The rule of thumb is public companies should be doing north of $450k per employee at scale. This is simple division. And I believe it cuts through all the noise - there’s nowhere to hide.
Revenue per Employee is calculated as: (TTM Revenue / Total Current Employees)
Rule of 40: How does a company balance topline growth with bottom line efficiency? It’s the sum of the company’s revenue growth rate and EBITDA Margin. Netting the two should get you above 40 to pass the test.
Rule of 40 is calculated as: TTM Revenue Growth % + TTM Adjusted EBITDA Margin %
A few other notes on efficiency metrics:
Net Dollar Retention is another great measure of efficiency, but many companies have stopped quoting it as an exact number, choosing instead to disclose if it’s above or below a threshold once a year. It’s also uncommon for some types of companies, like marketplaces, to report it at all.
Most public companies don’t report net new ARR, and not all revenue is “recurring”, so I’m doing my best to approximate using changes in reported GAAP revenue. I admit this is a “stricter” view, as it is measuring change in net revenue.
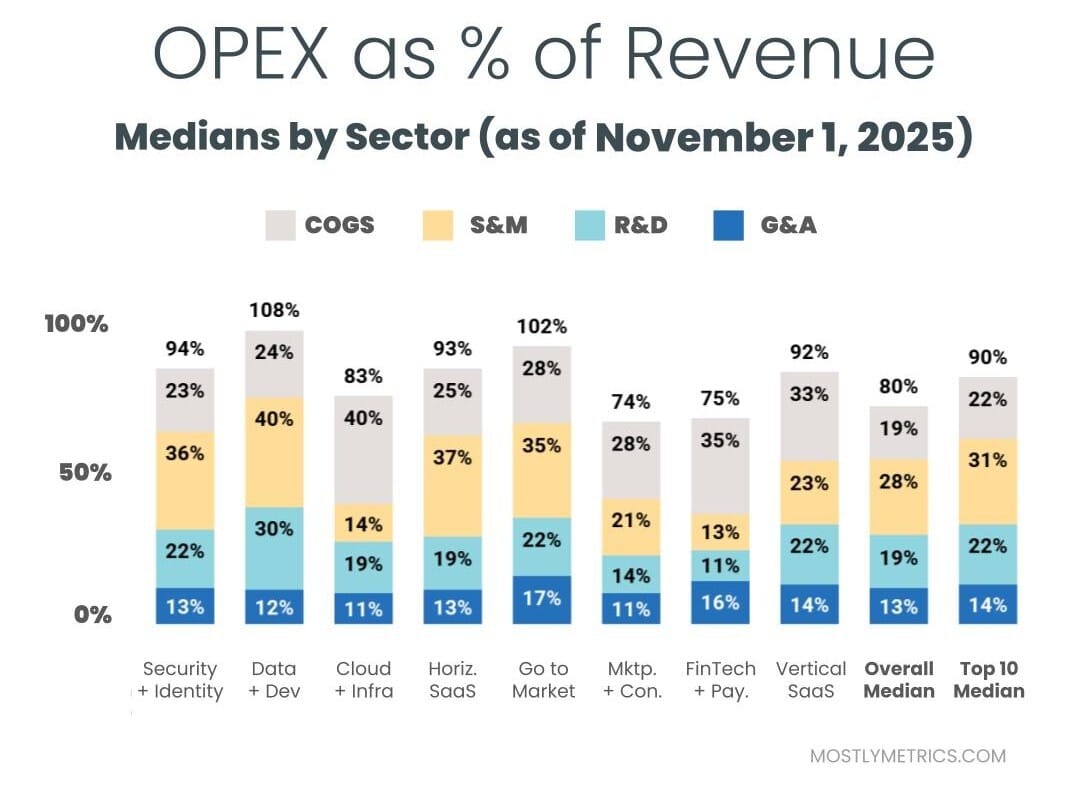
OPEX
Decreasing your OPEX relative to revenue demonstrates Operating Leverage, and leaves more dollars to drop to the bottom line, as companies strive to achieve +25% profitability at scale.
The most common buckets companies put their operating costs into are:
Cost of Goods Sold: Customer Support employees, infrastructure to host your business in the cloud, API tolls, and banking fees if you are a FinTech.
Sales & Marketing: Sales and Marketing employees, advertising spend, demand gen spend, events, conferences, tools.
Research & Development: Product and Engineering employees, development expenses, tools.
General & Administrative: Finance, HR, and IT employees… and everything else. Or as I like to call myself “Strategic Backoffice Overhead.”
All of these are taken on a Gaap basis and therefore INCLUDE stock based comp, a non cash expense.
Please check out our data partner, Koyfin. It’s dope.
Wishing you a forecast you can beat, and raise,
CJ


