Spoiler alert: No one measures SaaS metrics the same way.
And that inconsistency leads to misaligned expectations and missed goals.
That's why the Equals team—packed with analytics vets from the likes of Intercom, Stripe, and Atlassian—has distilled decades of their expertise into the The Guide to SaaS Metrics.
It's the definitive bible for measuring and reporting on your SaaS business the right way.
From LTV to net revenue retention, it covers everything you need to calculate, interpret, and act on the metrics that matter.
And get this: It's completely free.

“You Pick the Valuation, I Pick the Structure."
Raising a new round is a milestone for any startup—it validates the business, attracts talent, and, most importantly, brings in capital to fuel growth. But there’s an old phrase in venture capital that serves as a cautionary note:
“You pick the valuation, I pick the structure.”
It’s a reminder that not all valuations are created equal—and sometimes, pushing for the biggest number can lead to unexpected pitfalls, especially for founders who resist taking a downround.
The Allure of a Sky-High Valuation
Let’s face it: high valuations are seductive. They make headlines, generate FOMO, and serve as a badge of honor in founder circles. But they also create expectations from investors, employees, and the broader market that can be brutal to meet. When the numbers don’t pan out, the fallout can be severe.
Many founders focus on setting the highest valuation (or preserving the previous high), while investors are more focused on de-risking their investment. If investors agree to a lofty valuation, they’ll often introduce more aggressive terms to offset the risk. These “dirty terms” may be buried deep in the term sheet and can end up being far more costly than founders realize.
Here are a few common “dirty terms” that can come into play:
Liquidation Preferences: Investors might ask for a 2x, 3x, or higher liquidation preferences, meaning they get double or triple their investment back before common shareholders (i.e., founders and employees) see anything. Suddenly, a $100 million exit doesn’t look so appealing if you’ve raised $30 million with a 3x “liq pref”.
Participating Preferred Stock: With participating preferred, investors get their liquidation preference and also share in the remaining upside. It’s like going back up for seconds at the party while others are scooping their first helping —this can seriously dilute returns for founders and employees.
Ratchets: In the event of a downround, full or weighted-average ratchets can reset the investor’s ownership percentage, diluting everyone else. Thought you had 20%? Psych! It’s now 15%. Essentially, it’s an investor’s safety net to guarantee protection if things go south.
Veto Rights & Control Provisions: High valuations often come with investor-friendly veto rights, giving them a say on almost every major decision—hiring execs, raising another round, even selling the company. In a crunch, these provisions can stifle a founder’s autonomy.
Why Founders Still Push for High Valuations
If we put macro conditions to the side for a sec, why are founders like a moth to a flame for the highest valuation possible? Ego plays a role—there’s cachet in being "the unicorn CEO." But there’s also the fear of dilution; founders assume a higher valuation means giving up less equity. On the surface, if you make the number bigger, and give away the same percent of the business, the cash is cheaper.
In reality, the opposite often happens. Yes, a high valuation may mean fewer shares sold upfront, but accepting aggressive terms can outweigh the short-term dilution benefit. You can end up owning more of less when the time comes to settle up.
Preserving Perception vs. Reality
Ok, back to today’s market. Structured deals are often used to preserve headline valuations from earlier rounds, when capital was cheaper, and expectations were lower. Founders hesitate to take a downround, fearing it will unsettle employees, put previous investors underwater, or send a negative signal to customers. No one wants to go backwards. But pushing for a high valuation at any cost misses the point—raising capital should increase options, not limit them.
‘Fred’s Slacks’ is a WINNER!!!!
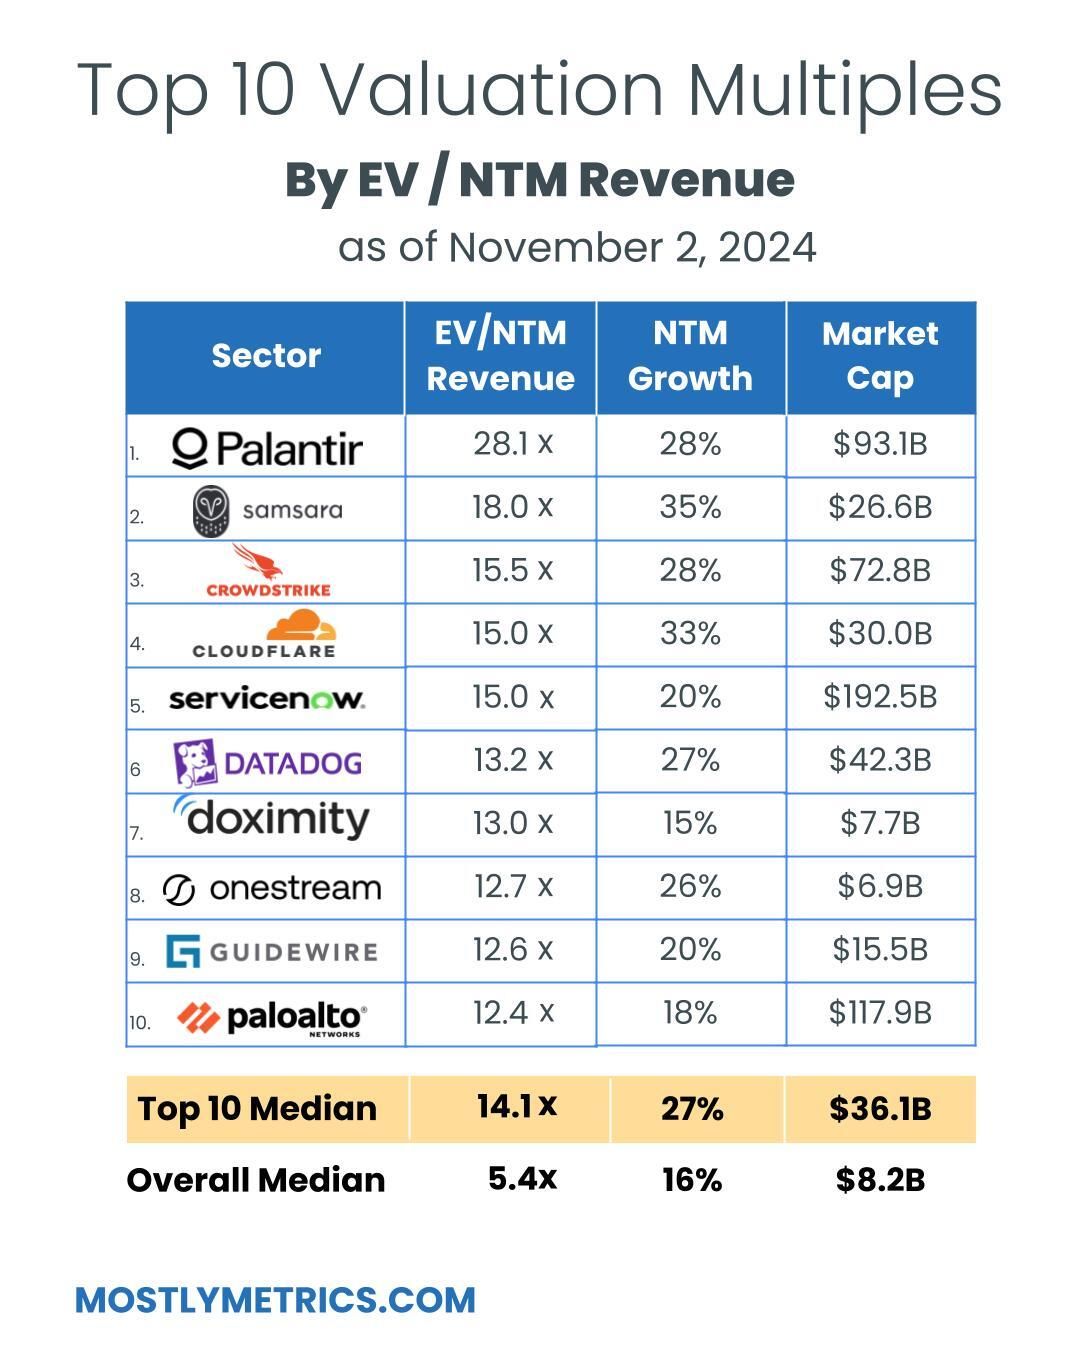
TL;DR: Multiples are FLAT week-over-week.
Top 10 Medians:
EV / NTM Revenue = 14.1x
CAC Payback = 17 months
Rule of 40 = 52%
Revenue per Employee = $531K


Figures for each index are measured at the Median
Median and Top 10 Median are measured across the entire data set, where n = 110
Population Sizes:
Security: 17
Database and Infra: 14
Backoffice: 16
Marcom: 16
Marketplace: 15
Fintech: 16
Vertical SaaS: 16
Revenue Multiples
Revenue multiples are a shortcut to compare valuations across the technology landscape, where companies may not yet be profitable. The most standard timeframe for revenue multiple comparison is on a “Next Twelve Months” (NTM Revenue) basis.
NTM is a generous cut, as it gives a company “credit” for a full “rolling” future year. It also puts all companies on equal footing, regardless of their fiscal year end and quarterly seasonality.

However, not all technology sectors or monetization strategies receive the same “credit” on their forward revenue, which operators should be aware of when they create comp sets for their own companies. That is why I break them out as separate “indexes”.
Reasons may include:
Recurring mix of revenue
Stickiness of revenue
Average contract size
Cost of revenue delivery
Criticality of solution
Total Addressable Market potential
From a macro perspective, multiples trend higher in low interest environments, and vice versa.
Multiples shown are calculated by taking the Enterprise Value / NTM revenue.
Enterprise Value is calculated as: Market Capitalization + Total Debt - Cash
Market Cap fluctuates with share price day to day, while Total Debt and Cash are taken from the most recent quarterly financial statements available. That’s why we share this report each week - to keep up with changes in the stock market, and to update for quarterly earnings reports when they drop.
Historically, a 10x NTM Revenue multiple has been viewed as a “premium” valuation reserved for the best of the best companies.
Efficiency Benchmarks
Companies that can do more with less tend to earn higher valuations.
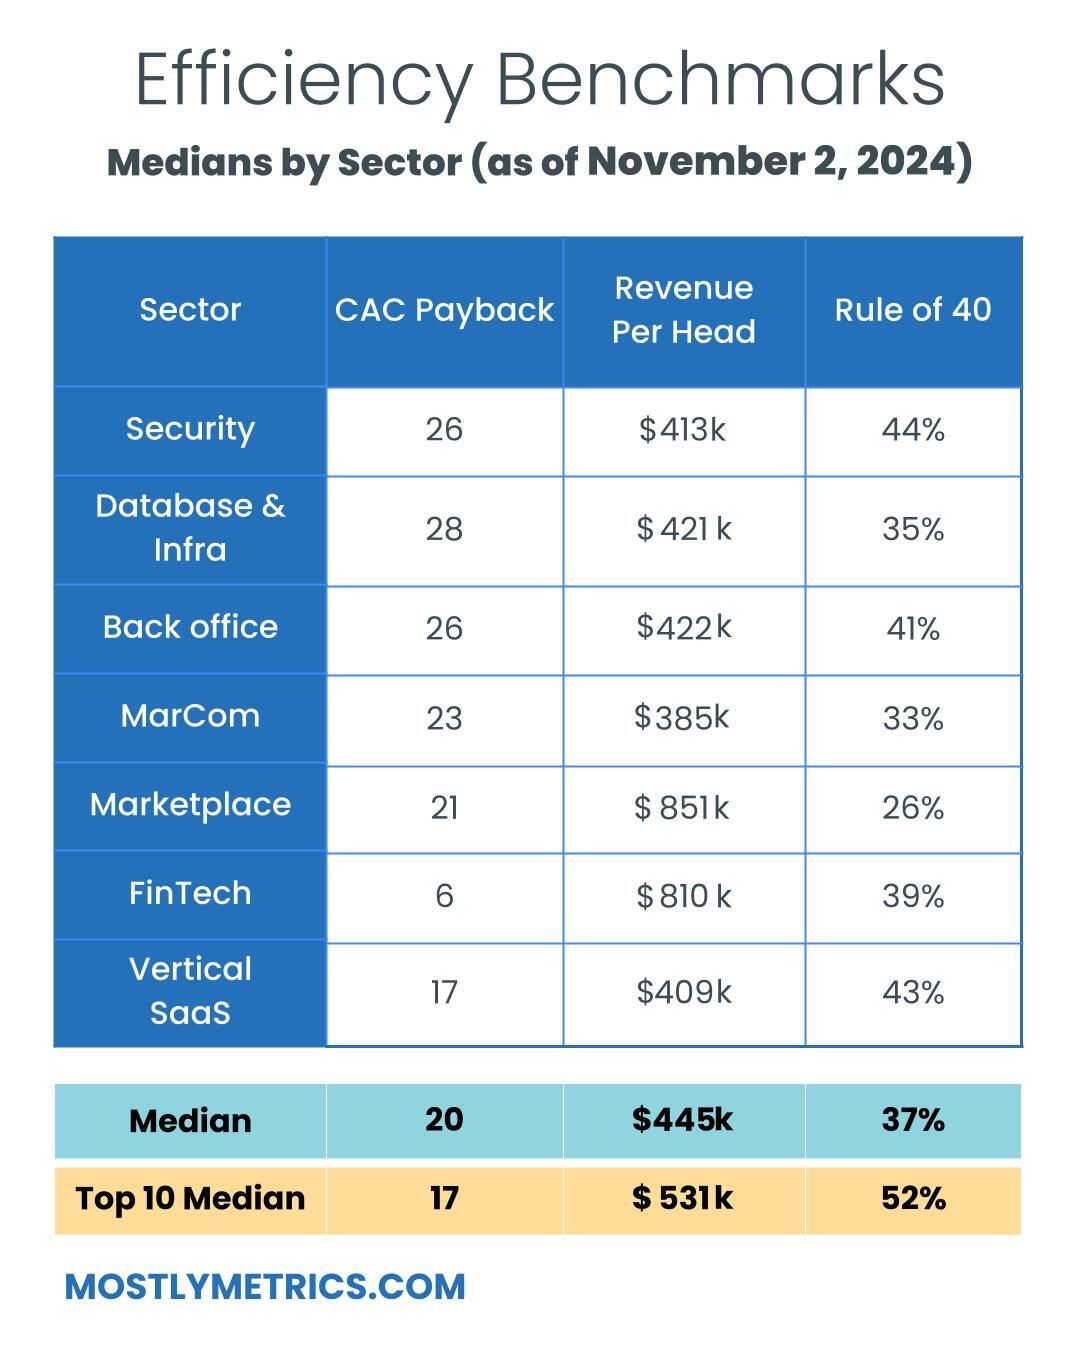
Three of the most common and consistently publicly available metrics to measure efficiency include:
CAC Payback Period: How many months does it take to recoup the cost of acquiring a customer?
CAC Payback Period is measured as Sales and Marketing costs divided by Revenue Additions, and adjusted by Gross Margin.
Here’s how I do it:
Revenue per Employee: On a per head basis, how much in sales does the company generate each year? The rule of thumb is public companies should be doing north of $450k per employee at scale. This is simple division. And I believe it cuts through all the noise - there’s nowhere to hide.
Revenue per Employee is calculated as: (TTM Revenue / Total Current Employees)
Rule of 40: How does a company balance topline growth with bottom line efficiency? It’s the sum of the company’s revenue growth rate and EBITDA Margin. Netting the two should get you above 40 to pass the test.
Rule of 40 is calculated as: TTM Revenue Growth % + TTM Adjusted EBITDA Margin %
A few other notes on efficiency metrics:
Net Dollar Retention is another great measure of efficiency, but many companies have stopped quoting it as an exact number, choosing instead to disclose if it’s above or below a threshold once a year. It’s also uncommon for some types of companies, like marketplaces, to report it at all.
Most public companies don’t report net new ARR, and not all revenue is “recurring”, so I’m doing my best to approximate using changes in reported GAAP revenue. I admit this is a “stricter” view, as it is measuring change in net revenue.
Operating Expenditures
Decreasing your OPEX relative to revenue demonstrates Operating Leverage, and leaves more dollars to drop to the bottom line, as companies strive to achieve +25% profitability at scale.
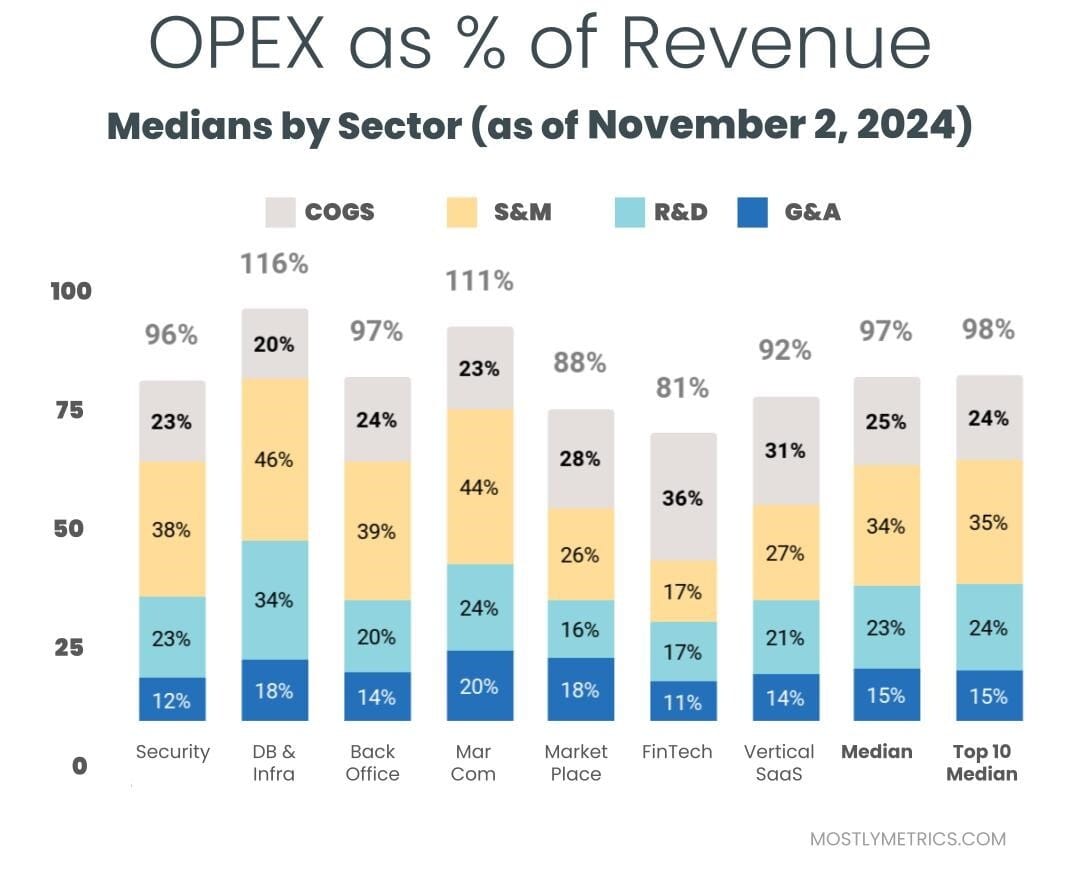
The most common buckets companies put their operating costs into are:
Cost of Goods Sold: Customer Support employees, infrastructure to host your business online, API tolls, and banking fees if you are a FinTech.
Sales & Marketing: Sales and Marketing employees, advertising spend, demand gen spend, events, conferences, tools
Research & Development: Product and Engineering employees, development expenses, tools
General & Administrative: Finance, HR, and IT employees… and everything else. Or as I like to call myself “Strategic Backoffice Overhead”
All of these are taken on a Gaap basis and therefore INCLUDE stock based comp, a non cash expense.
