
I’m just gonna be straight with you… there’s a TON of bad business advice flying around right now…
“Companies are only hiring AI engineers”…
“You need VC money to scale”…
“This economy is bad for starting a business”…
If you’ve fallen for any of these oft-repeated assumptions, you need to read Mercury’s data report, The New Economics of Starting Up. Mercury surveyed 1,500 leaders of early-stage companies across topics ranging from funding, AI adoption, hiring, and more, to set the record straight.
What they discovered is equal parts surprising and encouraging:
79% of companies surveyed, who have adopted AI, said they’re hiring more because of it.
Self-funding is the number one avenue for accessing capital — even for tech companies, with half likely to bootstrap.
87% of founders are more optimistic about their financial future than they were last year, despite prevailing uncertainties.
To uncover everything they learned in the report, click the link below.
*Mercury is a financial technology company, not a bank. Banking services provided through Choice Financial Group, Column N.A., and Evolve Bank & Trust; Members FDIC.

I’ll cut to the chase because you probably have a turkey to cook and a budget to finalize.
I dropped a thiccck report on AI in finance (download report).
(Note: My wife called it my “AI book report”, which, for the record, I find highly offensive)
And now I’m hosting a webinar for our readers on Tuesday December 9th to talk you through it. Please attend and be my friend so I have people to talk to.
What is OpenAI’s Path to $500B in Revenue?
On a recent episode of the Mostly Growth podcast, my cohost Kyle Poyar floated a spicy little thought exercise:
What would OpenAI have to do to hit $500 billion in annual revenue within the next five years?
To be clear, OpenAI hasn’t publicly thrown that number out there, at least not that I’ve seen. So before you jump down my throat and start saying stuff like “CJ, where did you get that number blah blah blah?”…
OpenAI’s operational model is super capital-intensive. I don’t need to waste more words explaining that to all you smart readers. A $500B revenue target implies a scale that can (hopefully) self-fund their ongoing innovation, rather than being perpetually reliant on Microsoft or Oracle or capital markets.
There have been persistent rumors about OpenAI targeting a $1 trillion IPO valuation in the short-ish term. To sustain that valuation (not just at IPO, but long-term), the company needs to show a believable path to revenue and margin levels that rival today’s mega-cap tech firms.
Tech companies with market caps over $1 trillion…
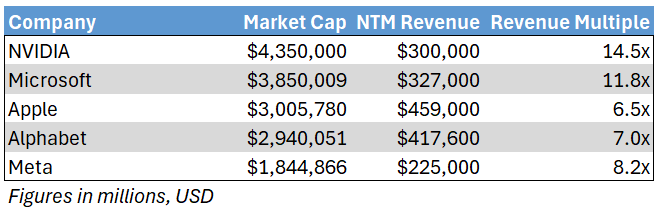
To be clear: I’m not saying they have to be at $500 billion in revenue when they IPO… I’m saying they have to demonstrate a credible medium-ish term path to substantiate the $1 trillion valuation when they ring the bell. So I’d venture that a number in the ballpark of $500 billion in revenue shows up in that 5 year forecast
It would put them in the same zip code as Apple and probably even bigger than where Microsoft and Google are heading in the next five years… that would mark a changing of the guards.
It’s a round number.
It’s fun to riff and you should stop being such an arbitrary revenue party pooper.

With that…
The company is rumored to end this year at $20 billion in ARR. That’s a big ol’ jump from $5 billion to start this year.
Current make up of their revenue is roughly 85% from ChatGPT. A lot of this is consumer, PLG, SaaSy type stuff. And 15% is the B2B API business stuff.
Funny enough, Anthropic is split the opposite way, with more than 85% of current biz weighted to the B2B opportunity.
Because of this current tilt towards B2C, for this thought exercise I’m going to assume they continue to lean into consumer focused monetization models.
(Sidenote: If we were to go full steam on B2B subscription, the largest B2B pure play SaaS comp would be Salesforce. But that would still only get them to $40 billion in revenue.)
OK, let’s go deeper on the consumer angle. What are the largest consumer subscription businesses from a revenue perspective?
Netflix is doing ~$40 billion in run rate revenue. They recently eclipsed 300 million paid subs (for context, the US population is around 330 million).
Amazon Prime is in a similar ballpark. around $40 billion in subscription revenue, charging ~$150 per year.
I’m excluding Costco here, even though their consumer membership model pulls in ~$5 billion annually, because it’s not tech. You don’t subscribe to Costco for content, software, or digital access. You do it to buy pallets of Gatorade and 48-packs of muffins. It’s recurring, sure, but it’s not a tech subscription in any meaningful sense.
(CJ takes out calculator and adds in his personal Strava subscription… OK, we’re still short.)
So becoming the largest B2C consumer subscription business in history would only get OpenAI 10% of the way to a $500B run rate. LOL.
For shits and giggles, let’s say they want to target getting 1/10th of the world to pay for ChatGPT.
To get to that high of a user penetration, you won’t be able to charge $20 a month globally
That would be too high a price for many markets.
So let’s use a blended, localized price of $10/month across ~800 million users.
Annualized, that gets you to a ~$100 billion run rate.
At two Netflix’s, you still have a long way to go.
Keep in mind they are at a rumored 20 million paying users today, across all plans. So just 780 million more users to get to that $100 billion run rate…
So you turn over the next stone: advertising.

This is a MASSIVE space.
Google’s ad revenue is about 75% of their total revenue, equating to just shy of ~$265 billion
Meta’s advertising revenue lags $100 billion behind Google’s, at ~$165 billion.
You can quickly see there’s clearly much more upside here.
And similar to both Google and Meta, OpenAI has the attention of consumers, and the habit forming stickiness as a destination. There are many ways to monetize this…Especially if you pair it with a take rate as the middleman on what’s being sold (Amazon) and a vig on the actual transaction (Stripe).
On top of the ads, if people are shifting shopping searches from Google over to ChatGPT, and have high intent based on their research, that is a great way to make money.
Amazon makes 8% to 15% in fees on purchases, and Stripe takes in ~3% (before paying the credit card companies). If we use a round number like 12%, assuming they find a way to also be a payments gateway (sorry, Stripe), they would need to facilitate $833 billion in sales for each $100 billion in net revenues.
So to get to $500 billion in the short term, they’d need to only:
Become the largest B2C subscription company in human history (actually plausible), and
Become one the three largest advertising companies, and
Take a meaningful piece of each transaction from those advertisements

I built it, but i don’t buy it.
Yes, you can squint your eyes, cast a magic spell, and maybe see a world where OpenAI gets halfway to $500 billion in five years. But becoming bigger than Apple, in less than a decade of monetizing, feels borderline delusional.
The leap from "amazing consumer app" to "THE dominant monetization layer of the internet" is one hell of a jump.
My real takeaway?
They’re already deep into B2C. So the future of their growth hinges on whether they can layer in the other monetization levers (ads, commerce, and payments) without tripping over themselves. In theory, they could triple dip on every user: subscription, ad click, and transaction take.
But that kind of execution requires a very deliberate layer cake strategy, where sequencing is everything.
And at the end of the day, the scarcest resource at any company isn’t money. It’s not even talent. It’s focus.
Keep ya eye on the ball, Sam!
Mostly Growth Podcast (subscribe!)
Me and Kyle go through this thought experiment live. Please subscribe to our new podcast. It’s critically acclaimed by three of my six siblings who gave it five stars (OK, I did it on their phones at my daughter’s birthday party).

TL;DR: Multiples are DOWN BIG week over week. There was a significant drop in tech stocks, with the top ten median falling from over 17x forward revenues into the 14x’s. The overall median is teetering on 4x.
Top 10 Medians:
EV / NTM Revenue = 14.7x (DOWN 2.7x w/w)
CAC Payback = 25 months
Rule of 40 = 51%
Revenue per Employee = $463k


Figures for each index are measured at the Median
Median and Top 10 Median are measured across the entire data set, where n = 147
Recent changes
Added: Navan, Bullish, Figure, Gemini, Stubhub, Klarna
Removed: Olo, Couchbase
Population Sizes:
Security & Identity = 17
Data Infrastructure & Dev Tools = 13
Cloud Platforms & Infra = 15
Horizontal SaaS & Back office = 20
GTM (MarTech & SalesTech) = 19
Marketplaces & Consumer Platforms = 18
FinTech & Payments = 28
Vertical SaaS = 17
Revenue Multiples
Revenue multiples are a shortcut to compare valuations across the technology landscape, where companies may not yet be profitable. The most standard timeframe for revenue multiple comparison is on a “Next Twelve Months” (NTM Revenue) basis.
NTM is a generous cut, as it gives a company “credit” for a full “rolling” future year. It also puts all companies on equal footing, regardless of their fiscal year end and quarterly seasonality.

However, not all technology sectors or monetization strategies receive the same “credit” on their forward revenue, which operators should be aware of when they create comp sets for their own companies. That is why I break them out as separate “indexes”.
Reasons may include:
Recurring mix of revenue
Stickiness of revenue
Average contract size
Cost of revenue delivery
Criticality of solution
Total Addressable Market potential
From a macro perspective, multiples trend higher in low interest environments, and vice versa.
Multiples shown are calculated by taking the Enterprise Value / NTM revenue.
Enterprise Value is calculated as: Market Capitalization + Total Debt - Cash
Market Cap fluctuates with share price day to day, while Total Debt and Cash are taken from the most recent quarterly financial statements available. That’s why we share this report each week - to keep up with changes in the stock market, and to update for quarterly earnings reports when they drop.
Historically, a 10x NTM Revenue multiple has been viewed as a “premium” valuation reserved for the best of the best companies.
Efficiency
Companies that can do more with less tend to earn higher valuations.

Three of the most common and consistently publicly available metrics to measure efficiency include:
CAC Payback Period: How many months does it take to recoup the cost of acquiring a customer?
CAC Payback Period is measured as Sales and Marketing costs divided by Revenue Additions, and adjusted by Gross Margin.
Here’s how I do it:
Sales and Marketing costs are measured on a TTM basis, but lagged by one quarter (so you skip a quarter, then sum the trailing four quarters of costs). This timeframe smooths for seasonality and recognizes the lead time required to generate pipeline.
Revenue is measured as the year-on-year change in the most recent quarter’s sales (so for Q2 of 2024 you’d subtract out Q2 of 2023’s revenue to get the increase), and then multiplied by four to arrive at an annualized revenue increase (e.g., ARR Additions).
Gross margin is taken as a % from the most recent quarter (e.g., 82%) to represent the current cost to serve a customer
Revenue per Employee: On a per head basis, how much in sales does the company generate each year? The rule of thumb is public companies should be doing north of $450k per employee at scale. This is simple division. And I believe it cuts through all the noise - there’s nowhere to hide.
Revenue per Employee is calculated as: (TTM Revenue / Total Current Employees)
Rule of 40: How does a company balance topline growth with bottom line efficiency? It’s the sum of the company’s revenue growth rate and EBITDA Margin. Netting the two should get you above 40 to pass the test.
Rule of 40 is calculated as: TTM Revenue Growth % + TTM Adjusted EBITDA Margin %
A few other notes on efficiency metrics:
Net Dollar Retention is another great measure of efficiency, but many companies have stopped quoting it as an exact number, choosing instead to disclose if it’s above or below a threshold once a year. It’s also uncommon for some types of companies, like marketplaces, to report it at all.
Most public companies don’t report net new ARR, and not all revenue is “recurring”, so I’m doing my best to approximate using changes in reported GAAP revenue. I admit this is a “stricter” view, as it is measuring change in net revenue.
OPEX
Decreasing your OPEX relative to revenue demonstrates Operating Leverage, and leaves more dollars to drop to the bottom line, as companies strive to achieve +25% profitability at scale.

The most common buckets companies put their operating costs into are:
Cost of Goods Sold: Customer Support employees, infrastructure to host your business in the cloud, API tolls, and banking fees if you are a FinTech.
Sales & Marketing: Sales and Marketing employees, advertising spend, demand gen spend, events, conferences, tools.
Research & Development: Product and Engineering employees, development expenses, tools.
General & Administrative: Finance, HR, and IT employees… and everything else. Or as I like to call myself “Strategic Backoffice Overhead.”
All of these are taken on a Gaap basis and therefore INCLUDE stock based comp, a non cash expense.
Please check out our data partner, Koyfin. It’s dope.
Wishing you a Revenue per Head that makes sense for your business model,
CJ


