Quick plug to check out this week’s Run the Numbers Pod with Shippo’s CFO, Olivier Adler. We discuss his experience selling to Amazon, the “oh shit” moment when a powerful incumbent starts competing with your startup, and more.
The beauty and chaos of Usage Based Pricing (UBP)
Usage Based Pricing comes with its puts and its takes.
The Beauty:
Less friction to start: Customers can start with a smaller commitment, or even no commitment at all.
Start small, and get jacked: And if they like you, they’ll ramp up their usage over time. Expansion shows up in an increased Net Dollar Retention Rate.
Easier access: By not being tied to a strict per-seat model, you can make your product (and its usage) more accessible to workers across teams.
More upsell opportunities: You talk with your customers on a pretty frequent basis to understand their spend, which provides an opportunity to sell them other stuff.
Transparency breeds loyalty: You are intimately linked to a value metric. Customers pay for what they use. There’s no hiding from it.
The Chaos:
Easier to scale back during macro headwinds: The same volatility on the way up also exists on the way down. When times get tough, it’s much easier to “optimize” your usage compared to Subscription models.
Misconfiguration mistakes can frustrate customers: Set up for many of the infrastructure related UBP products (e.g., AWS, GCP, OpenAI) is way more complicated than your typical IKEA desk. And if you hook up something wrong or leave the faucet running over night, it can wrack up a MASSIVE bill.
Harder to forecast: Remember - you don’t charge the same thing each period. So you have to get really close to exactly how customers use your product. Plus, the model is more prone to calendar seasonality than classic Subscription models.
Customers may churn out the top entirely: Customers who grow revenue the fastest may become the biggest challenges in later years. Over time every CFO will want a better way to forecast and control expenses, or a newer, cheaper alternative will emerge. It’s possible to become so embedded, and expensive, that they just can’t afford you anymore. In this sense, you become a victim of your own success.
With that said, here are the metrics I’d track closely to lean into the beauty of usage based models. I’ve relied on real life examples from the likes of Snowflake, Twilio, Dropbox, DataDog, Procore, Elastic, Uber, and Event Brite.

With consumption, revenue is only recognized when customers use your product. For example, if you charge by number of widgets scanned, and a customer scans 10 widgets, then revenue is recognized at the rate of (10) multiplied by your “per widget” value metric.
As such, the more a customer consumes, the more revenue you recognize. Monitoring, tracking, and managing usage is critical to executing your consumption model.
The ability to forecast future usage is a valuable KPI you’ll want at your fingertips on a daily basis, as it enables you to constantly evaluate usage and discover any early warning signs of under, or over, usage.
In the words of Snowflake:
“This [consumption] forecast also guides your funders and management team on the early growth trajectory of the business, informs strategies on where to go next, and helps you continue to innovate.”
-Source: Snowflake’s Consumption-Based Pricing Playbook
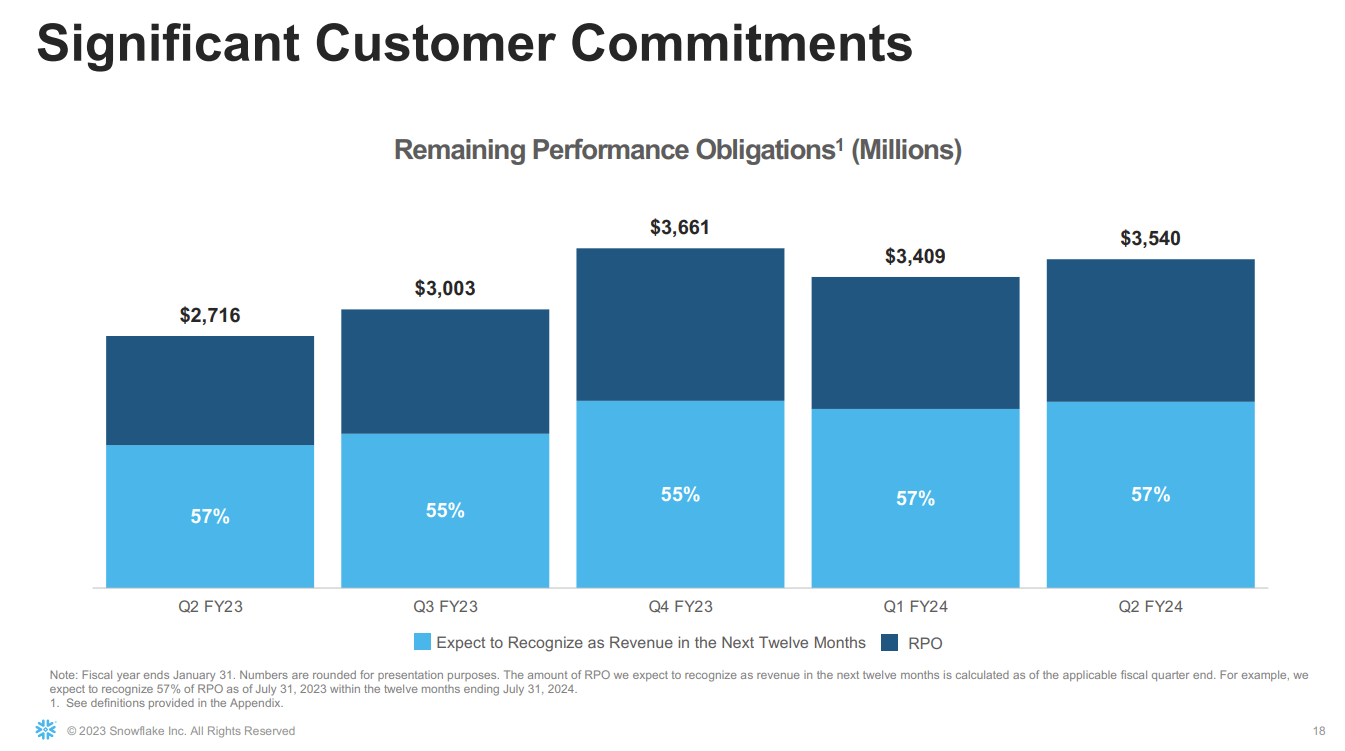
RPO is a non-Gaap accounting metric that measures the amount of contractual (committed) revenue that a SaaS provider is obligated to deliver for customers to consume in the future.
In many ways, you can think of this as a proxy for future revenue. But it’s important to point out that it’s not synonymous - actual usage will vary depending on what the customer actually needs day to day. RPO is just based on the amount they’ve “committed” to spend over a specific term.
For example, a customer may commit to a three year contract for $100K worth of credits per year (or $300K total contract value). Since RPO can be split into Current (within the next 12 months) and Long Term (more than 12 months out) buckets, current RPO would be $100K at the start of the contract and Long Term RPO would be $200K.
However, there will have to be a true up at the conclusion of each period as to how much the customer actually consumed in order to get your revenue recognition right.
If you are a consumption business, or an investor in one, RPO can be seen as a leading indicator for future growth, and a way to “de-risk” the future.
NDR = (Total ARR from existing customers to start the measurement period + Expansion Dollars from those customers - Churn from those customers - Shrink from those customers) / Total ARR from existing customers to start the measurement period
A Net Retention of 130% essentially tells you,
“If I packed up shop and didn’t sell another thing for the next year, I’d still grow by 30% ”
That’s pretty powerful. Anything over 100% is future growth embedded into your business model. Net retention plays itself out as either a dividend or a tax on every customer you acquire, and the more customers you acquire over time, the more this stacks up.
The simplest way to think of it is selling either more licenses or more products. We can actually decompose Net Retention into four distinct levers:
You decrease churn (Gross Retention)
Your customer buys more products (Cross Sales)
Your customer buys more licenses (Product Penetration)
You drive more usage of a product they already bought (Volume)
NDR is inherently higher for usage based products where the end merchant initially tries in smaller increments and then scales their spend month over month as the product becomes a part of their core workflows.

Mostly advice: Make sure that you only include expansion dollars from customers on board at the start of your measurement period. Sometimes companies will let the dollars from net new customers who expand early slip in, which inflates the numerator without burdening the “starting ARR” in your denominator.
Product Attach Rate = Total Products Sold / Total Customers

DataDog is the king of multi product attach. More than 20% of their customers are using SIX (I repeat, SIX!) of their products. Talk about being sticky.
Three things to be aware of when reporting this metric:
Understand your saturation range:
It’s very common for an attach rate to plateau, or sometimes even decline, around ~75%. And if people don’t understand the metric and see it slow down, they may panic.
But it’s pretty natural to hit a saturation point for any product-attach count. So you should stop reporting at a predetermined saturation rate so there are no surprises, and roll it off for a new cut with more headroom and decision making significance.
Give new products time to stabilize
New products take some time to ramp within your customer base, and may experience some ups and downs for the first few quarters.
You’ll usually want to wait until the new cut has achieved three quarters of successive increases before adding.
Beware of product rationalization / cannibalization
And you need to make sure that customers aren’t rationalizing one of your products for another (e.g., staying at 3 total products due to budget constraints by churning a less critical product for a recently launched product).
There may only be so much wallet share for you to gobble up within a single customer (unless you’re DataDog, lol)
Uber demonstrates that customers who use more than one product spend more and retain better.

(Cost of Sales and Marketing / Number of New Customers Acquired)
Customer Acquisition Cost is what you spend in sales and marketing costs to go out and get a net new customer.
CAC Payback Period is a derivative of Customer Acquisition Cost, and spits out the number of months it takes to breakeven on that new customer.
($ Previous Period’s Sales and Marketing Expenses) / (This Period’s New + Expansion ARR x % This Period Gross Margin) x 12
How many months does it take to recoup that initial cash outlay?
The smaller your customer’s Average Order Value (AOV), the lower you want your payback period to be.
Sales and Marketing Expenses: S&M should be lagged according to the average sales cycle of the sales engine you’re measuring. The goal is to align the dollars you spent in the past to generate the sales you are seeing today. This is important if you are hiring quickly. You don’t want the costs of new hires who haven’t sold anything yet (deadbeats!) to show up in the CAC Payback for today’s additions. Examples of lagging by segment:
Enterprise sales cycle of 180 days = 2 quarter S&M lag
Mid-Market sales cycle of 90 days = 1 quarter S&M lag
SMB sales cycle of 30 days = 0 quarter S&M lag
NOTE: I’m lagging everything by one quarter (or period) in my examples above; this is the most common way to do it. You can get fancier and do, say, five months.
Cost of Goods Sold (COGS): This includes hosting costs, customer support, and customer success. It’s basically the ongoing costs you incur to keep your install base around. It’s taken from the period you are measuring, with no lag.
New ARR: This represents your in-period additions to your topline, preferably measured in ARR. It is NOT your total MRR or ARR - just net new. Also, it is not your GAAP revenue, which is an accounting based measurement of topline, and recognized ratably. You will look worse when using changes in GAAP revenue, due to the timing aspect of it.
Generally, all of these figures are best measured on an aggregated trailing twelve month basis to smooth for seasonality. Most companies add more ARR in their fourth quarter than the rest of the year. This means your S&M will technically need to go back 5 quarters (or 15 months) if you are lagging by one quarter. Otherwise, looking at it monthly can result in a graph that looks like a heart EKG.
$ Average Annual Revenue per Account / % Average Account Churn Rate x Gross Margin
Customer Lifetime Value (LTV) estimates the total amount of money you’ll get from a customer before they churn out. It effectively tells you,
“If I add up all the deals I do with a customer across every year I think I’ll have them, on average I’ll squeeze a total of [$x] out of them before they bounce”
Average Annual Revenue per Account: Pretty self explanatory. Note that this is easiest to estimate for subscription businesses, since they’ll pay a consistent amount each period. But you can still calculate LTV for usage based businesses by using the last few months of activity as a proxy, or the commitment values they’ve signed up for (which we discussed above).
Average Account Churn Rate: This is the inverse of your average account retention rate. Note that it’s measured on an account, not dollar denominated, basis. This is important because you might have a much better dollar denominated churn (or retention) rate, as higher paying customers subsidize the smaller pots and pans who churn out more often. This is also easier to predict for subscription businesses because churn is pretty black and white - you know when they leave.
Gross Margin: This is what’s left over after paying for your cost of goods sold.
Like CAC Payback period, all of these figures are best measured on a trailing twelve month basis to smooth for seasonality. I can’t stress this enough. If you have one bad retention quarter it may cause your LTV to drop precipitously (shout out spell check).

LTV / CAC
Now that you have a grip on LTV, you’ll want to compare it to your Customer Acquisition Cost (CAC). Knowing your LTV is great, but it’s not very useful in a vacuum.
In other words, LTV and CAC go hand in hand. You don’t really know what good LTV is without knowing your CAC.
This goes up with your multi product attach rate, as you upsell more products to the same user and gobble up more wallet share.
Activity that drives consumption is CRITICAL to watch if you rely on a usage based pricing model. DAUs and MAUs tell you where your revenue is going.
In terms of defining a Daily or Monthly Active Users, “Active” is the important word - it should represent a customer performing an action that is tied to the product’s core value proposition. For example, if you are a security product, it might be running a vulnerability test to detect bugs. It can’t simply be logging on. That’s lame.
And when you go to measure active users, do it over a period of time that aligns with how often someone should realistically use your product for said value creation.
If your product is a social app or music streaming service like Spotify, you may measure activity on a daily basis (DAUs). But if your product is built for Sales Tax Reporting, it may be smarter to align the timeframe to the accounting month end close.
AOV = Total revenue / Number of transactions
This is how much you get from each order or transaction. You can think of it as your average cart size.
Most usage based companies pick one of two strategies: either having a high velocity of smaller transactions (the Office Space model of clipping a fraction of a penny off each transaction) or working towards a higher priced, less frequent transaction (like Redfin taking 2% of your home’s sale). Ideally you’d want the best of both worlds (high value + high frequency), but easier said than done.
Knowing your Average Order Value is key to increasing Average Revenue per User (ARPU). There are two ways to increase ARPU - increasing average order size or increasing velocity of orders. More on that below.
This metric aggregates the AOVs across multiple products and transactions for a single customer over a specific period of time. It signals how much wallet share you can gobble up. Ideally this grows period to period, demonstrating that your value is increasing.
Below you can see Dropbox’s ARPU (bar chart on far right) growing y/y. Part of this is admittedly due to inflation. The other core drivers may be:
More products
Plan upgrades
Increased usage

Payment companies and middlemen (platforms, marketplaces, aggregators) rely on usage based models. Increasing take rate over time allows you to capture a greater portion of each spend and demonstrates leverage.
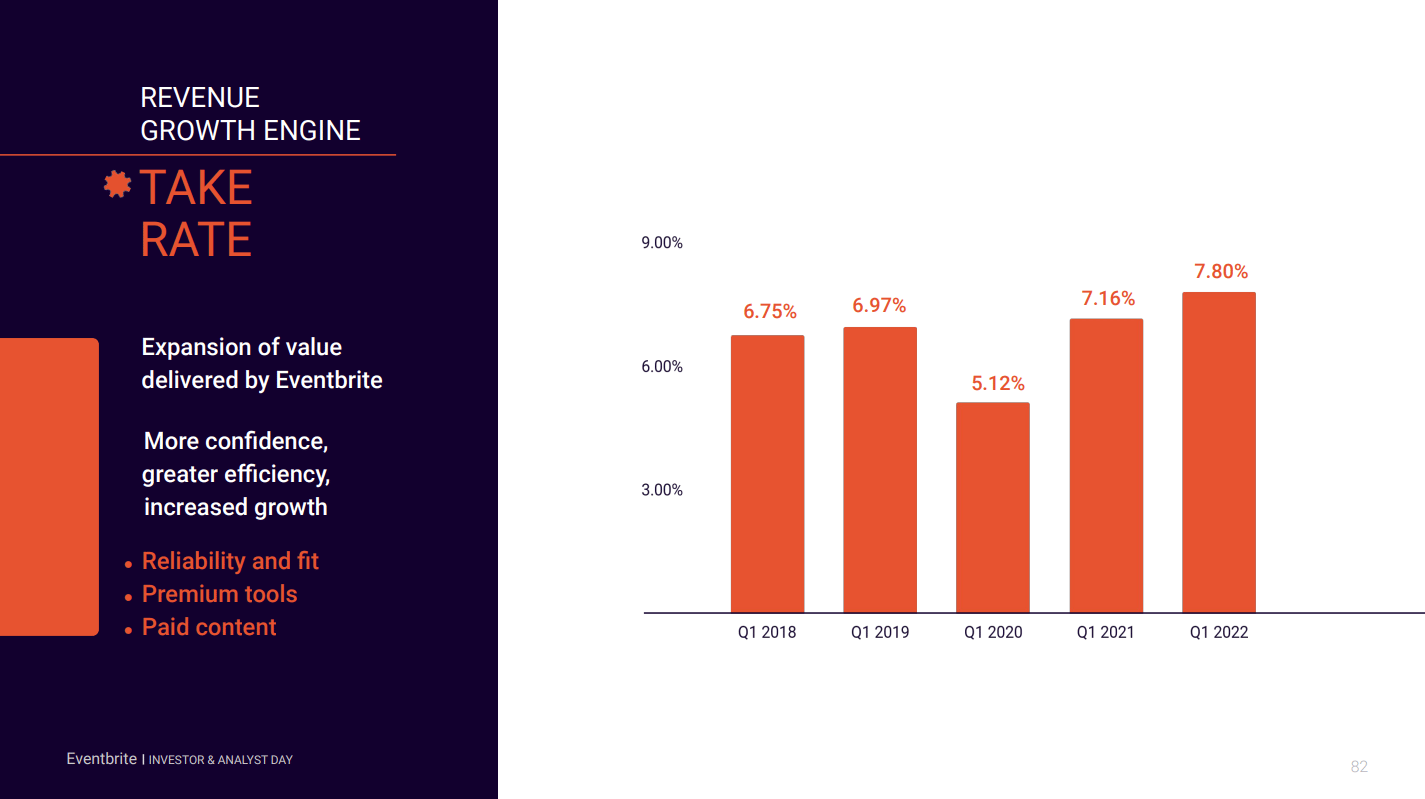

For usage based models, as you increase your ARPU you want to see your customers graduate up the ARR bands. You may land a customer with a small commitment of $5K, but over time your goal is to get them to the $10K bucket, then $25K bucket, etc.
Twilio likes to call out their customers by $100K, $1M, $5M, and $10M per year ARR bands. I would venture to guess that most customers did not start in the bands they are in today.
Month 1 Churn = (# of 1st time customers from Month 1 who buy again in Month 2) / (# of total 1st time customers in Month 1)
For usage based models where there is no contractual obligation, you’ll want to keep a VERY close eye on your month one retention. The inverse of this is Month 1 churn.
For paid users, how many try you in one month and then come back within the next 30 days to purchase again?
If you have 100 new customers in January, and 85 come back to purchase again in February, you have a month 1 churn rate of 15%. You want to stop the churn nose bleed as early as possible by making customers successful fast. By fundamentally changing their behavior, you’ll keep them coming back in future months so they generate more lifetime value.
A word from today’s sponsor
I’m going to be honest; what Mosaic has built for FP&A teams is dope. When you use their software, you instantly know it was built by people who “get” FP&A. As someone who’s been duped into big box solutions that don’t fit my actual tasks before, I appreciate this shift to value.
Mosaic was founded in 2019 by three finance leaders who knew the office of the CFO needed an overhaul. Tasked with supporting business decisions for several companies in hyper-growth, they were frustrated by the slow speed, high complexity and inefficiencies existing tools in the market offered.
Today, Mosaic is deployed by some of the fastest growing companies, helping them align, collaborate and plan for the future. Get a demo. Tell them the crazy metrics guy sent you.
Quote I’ve Been Pondering
“As the Haitian proverb puts it: Behind mountains are more mountains.”
-The Obstacle is the Way by Ryan Holiday
