👋 Hi, it’s CJ Gustafson and welcome to Mostly Metrics, my weekly newsletter where I unpack how the world’s best CFOs and business experts use metrics to make better decisions.
Fintech isn’t a monolith. And neither is how you value it.
Fintech valuation is less about the top line and more about what’s underneath it.
To drive the point home, I present to you one of the greatest scenes in cinematic history:
“For your information, there’s a lot more to ogres fintechs than people think….
Ogres fintechs are like onions… onions have layers.”
-Shrek
And underneath, you’ll find a mix of beautiful recurring revenue... and some stuff that looks good until the Fed sneezes.
So I asked a fintech founder to rank the major revenue streams by what actually matters: how much of that revenue turns into gross profit (assuming you've nailed the basics…low churn, solid CAC, healthy NRR).
Here's how it shook out.
🥇 The FinTech Power Rankings
(Based on gross profit durability)
#1. SaaS or Usage-Based
The gold standard. SaaS and usage-based fintech revenue is sticky, reliable, and typically comes with strong NRR.
But don’t forget the fine print—long enterprise sales cycles and expensive S&M investments are the price of admission. At scale, your CAC becomes your model.
Think Plaid, Middesk, and Modern Treasury—companies building mission-critical APIs and B2B financial workflows that become embedded over time.
#2. Payments
Payments revenue is embedded, sticky, and margin-friendly—if you do it right.
Customers can switch processors, but once you’re in the flow of funds, you’re hard to rip out.
Note: When considering payments gross margin you’ve gotta contemplate any credit card interchange fees, and make sure it’s net of rewards + funding costs. Don’t cheat.
Stripe, Adyen, Brex, and Square (Block Payments) live here.
Stripe’s premium isn’t just about growth. It’s their blend of deeply embedded infrastructure (you don’t just rip out your payment processor over night) and high-margin software layers. That’s how you get a 20x revenue multiple in a world where most fintechs scrape by at 3x. People build both businesses and APIs on top of you.
#3. AUM (Assets Under Management)
AUM-based revenue ties fees directly to the size of the customer’s portfolio.
Solid, recurring, and sticky—until markets turn south and compress asset values (and your fees along with them).
You see this model in places like Wealthfront, Betterment, and Robinhood Gold, which charge a cut of assets under management.
#4. Trading
This is the adrenaline junkie’s revenue stream—great in bull markets, absolutely brutal when things turn sideways. Feast or famine.
Robinhood, Coinbase, and Public.com are perfect examples, living and dying with market volume and investor appetite.
#5. Debit Card Interchange
Predictable—until it isn’t. Debit interchange is heavily regulated under the Durbin Amendment, and any future tweaks could squeeze margins. But today, it still fuels a lot of neobank economics.
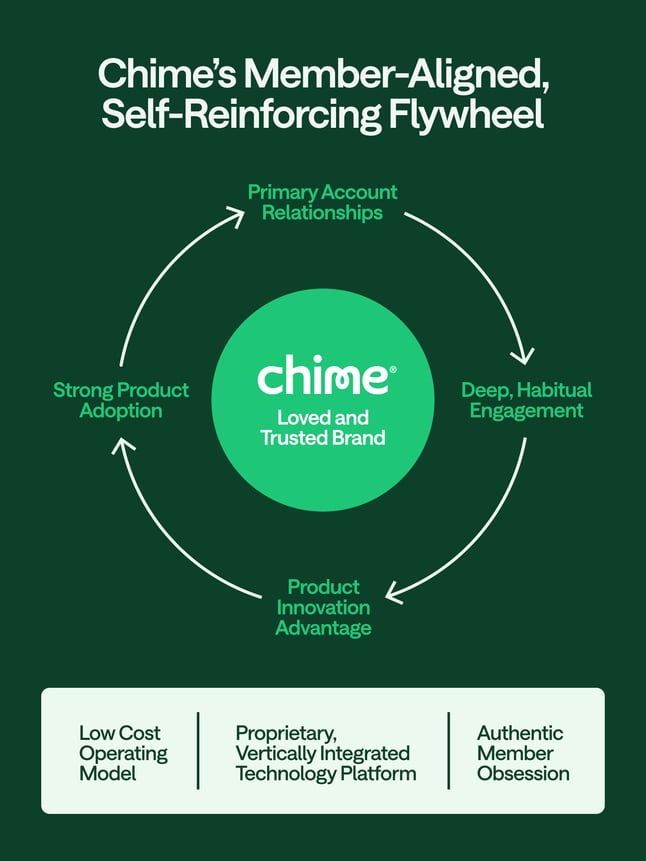
Chime, Current, and Step play in this sandbox, generating reliable (if capped) revenue streams from debit swipe fees.
#6. Float
Float revenue is tied directly to interest rates—booming when the Fed is feeling generous, drying up when they cut.
It’s easy money in a 5% world, but not a durable long-term model without stacking other products on top.
Mercury built its original business model on float, and Wise earns meaningful spread from holding customer balances.
#7. Insurance
Insurance can be a beautiful business with high margins, if you price risk correctly. But it’s capital-heavy and highly cyclical, especially when macro shocks hit.
Lemonade, Root Insurance, and Next Insurance are fintech-first players trying to reshape the traditional insurance model (with mixed results).
#8. Lending
At the bottom of the stack: lending. It’s lucrative when credit flows easily but brutal when defaults spike.
Lending requires lots of capital, careful underwriting, and risk reserves that crush profitability when markets tighten.
Klarna and Affirm are examples of players navigating these waters. They scale quickly in boom times, but feel the pain during downturns.
Brick by Brick: Stacking Revenue
The best fintechs don’t stop at a single revenue model. They stack them.
SaaS + Payments.
Lending + Merchant Services.
Banking + Ads.
Why? Because each stream has different strengths, and different vulnerabilities. When one wobbles, another can carry the weight.
Stripe layered software tools on top of payments infrastructure.
Mercury started with float but built out card interchange and SaaS-like features for founders.
Klarna is using its scale in BNPL to spin out an ads and data platform for merchants.
The magic isn’t just in diversification. It’s in strategic sequencing. Use one competitive advantage to unlock the next.
Fintechs that win big don’t just pick a revenue model—they build a portfolio. And investors reward that kind of resilience.
If You’re Building a Fintech
If you're building or backing a fintech, ask yourself:
Is this revenue recurring or recyclable?
Does it scale without capital?
Is it margin-rich or just loud?
And most importantly—who owns the rails?
As someone who’s obsessed with using revenue multiples as a short hand, I constantly need to remind myself that it’s ultimately about multiples of GROSS PROFIT when you size up fintech’s.
Payments, trading, and even float can bloat top-line numbers, but they’re often thin-margin businesses. You want to know what’s real? Look at how much drops to gross profit, not just what lights up the “ARR” dashboard (in fact, most fintech “ARR” isn’t actually “ARR”, but we don’t have time for that debate in this post).
In FinTech, revenue is merely a leading indicator. Gross profit is reality. And the durability is reflected in the multiple.

TL;DR: Multiples are UP week-over-week.
Top 10 Medians:
EV / NTM Revenue = 14.5x (UP 0.5x w/w)
CAC Payback = 30 months
Rule of 40 = 52%
Revenue per Employee = $405k

Figures for each index are measured at the Median
Median and Top 10 Median are measured across the entire data set, where n = 111
Population Sizes:
Security: 18
Database and Infra: 14
Backoffice: 16
Marcom: 16
Marketplace: 15
Fintech: 16
Vertical SaaS: 16
Revenue Multiples
Revenue multiples are a shortcut to compare valuations across the technology landscape, where companies may not yet be profitable. The most standard timeframe for revenue multiple comparison is on a “Next Twelve Months” (NTM Revenue) basis.
NTM is a generous cut, as it gives a company “credit” for a full “rolling” future year. It also puts all companies on equal footing, regardless of their fiscal year end and quarterly seasonality.

However, not all technology sectors or monetization strategies receive the same “credit” on their forward revenue, which operators should be aware of when they create comp sets for their own companies. That is why I break them out as separate “indexes”.
Reasons may include:
Recurring mix of revenue
Stickiness of revenue
Average contract size
Cost of revenue delivery
Criticality of solution
Total Addressable Market potential
From a macro perspective, multiples trend higher in low interest environments, and vice versa.
Multiples shown are calculated by taking the Enterprise Value / NTM revenue.
Enterprise Value is calculated as: Market Capitalization + Total Debt - Cash
Market Cap fluctuates with share price day to day, while Total Debt and Cash are taken from the most recent quarterly financial statements available. That’s why we share this report each week - to keep up with changes in the stock market, and to update for quarterly earnings reports when they drop.
Historically, a 10x NTM Revenue multiple has been viewed as a “premium” valuation reserved for the best of the best companies.
Efficiency Benchmarks
Companies that can do more with less tend to earn higher valuations.

Three of the most common and consistently publicly available metrics to measure efficiency include:
CAC Payback Period: How many months does it take to recoup the cost of acquiring a customer?
CAC Payback Period is measured as Sales and Marketing costs divided by Revenue Additions, and adjusted by Gross Margin.
Here’s how I do it:
Revenue per Employee: On a per head basis, how much in sales does the company generate each year? The rule of thumb is public companies should be doing north of $450k per employee at scale. This is simple division. And I believe it cuts through all the noise - there’s nowhere to hide.
Revenue per Employee is calculated as: (TTM Revenue / Total Current Employees)
Rule of 40: How does a company balance topline growth with bottom line efficiency? It’s the sum of the company’s revenue growth rate and EBITDA Margin. Netting the two should get you above 40 to pass the test.
Rule of 40 is calculated as: TTM Revenue Growth % + TTM Adjusted EBITDA Margin %
A few other notes on efficiency metrics:
Net Dollar Retention is another great measure of efficiency, but many companies have stopped quoting it as an exact number, choosing instead to disclose if it’s above or below a threshold once a year. It’s also uncommon for some types of companies, like marketplaces, to report it at all.
Most public companies don’t report net new ARR, and not all revenue is “recurring”, so I’m doing my best to approximate using changes in reported GAAP revenue. I admit this is a “stricter” view, as it is measuring change in net revenue.
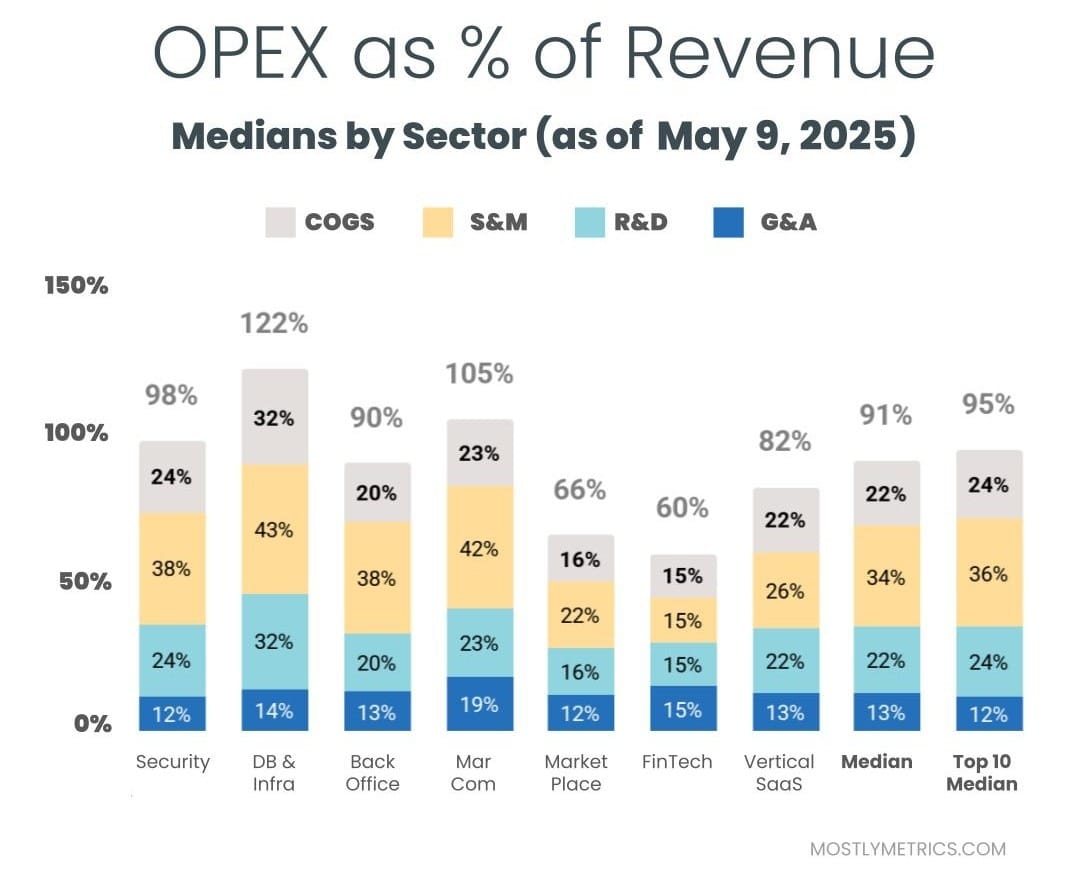
Operating Expenditures
Decreasing your OPEX relative to revenue demonstrates Operating Leverage, and leaves more dollars to drop to the bottom line, as companies strive to achieve +25% profitability at scale.

The most common buckets companies put their operating costs into are:
Cost of Goods Sold: Customer Support employees, infrastructure to host your business in the cloud, API tolls, and banking fees if you are a FinTech.
Sales & Marketing: Sales and Marketing employees, advertising spend, demand gen spend, events, conferences, tools.
Research & Development: Product and Engineering employees, development expenses, tools.
General & Administrative: Finance, HR, and IT employees… and everything else. Or as I like to call myself “Strategic Backoffice Overhead.”
All of these are taken on a Gaap basis and therefore INCLUDE stock based comp, a non cash expense.


