
It’s Turtles DCFs All the Way Down
Tech companies die, or live long enough to find themselves in a Discounted Cash Flow Model.
Once you start to produce revenue - the race is on!
“It’s not about how much you earn - it’s about what you’re worth -and who’s worth the most? Companies that lose money!”
-Russ Hanneman
Richard Hendricks’ reply is classic - mainly the goal of companies is to make money.
To take that a step further, the goal is to (eventually) produce free cash flows…
I asked my friend, Fred Havenmeyer, sell side equity analyst at Macquarie,
“At the end of the day, does everything I give you end up in a DCF model?”
He answered:
“It depends on how artful you are.
At the end of the day, yes, most of the things do end up in a DCF.
But a DCF only tells part of the story. It gives you that fundamental grounding as an analyst to say that I believe a company’s future cash flows are worth some amount today based on my inputs and assessments…
…Your metrics go into a DCF, but you’ve gotta be a solid management team, you have to have a good track record, and you have to do so with solid communication of your metrics.
At the end of the day, a DCF is only as good as the expectations that a team will actually be able to deliver on those future cash flows.”
DCFs are perhaps overly scientific, highly dependent on assumptions, and kinda fictional, but the point is - investors are testing for free cash flows. Profits. Dollars. Dinero. Dope on the table.

DCFs are a tool, not an end all be all, to test for the future viability of a business. But nonetheless, if you live long enough, you end up in that tool. And you have to pass that test. So as an Operator, if you work backwards, it’s like you already know the answers to the test.

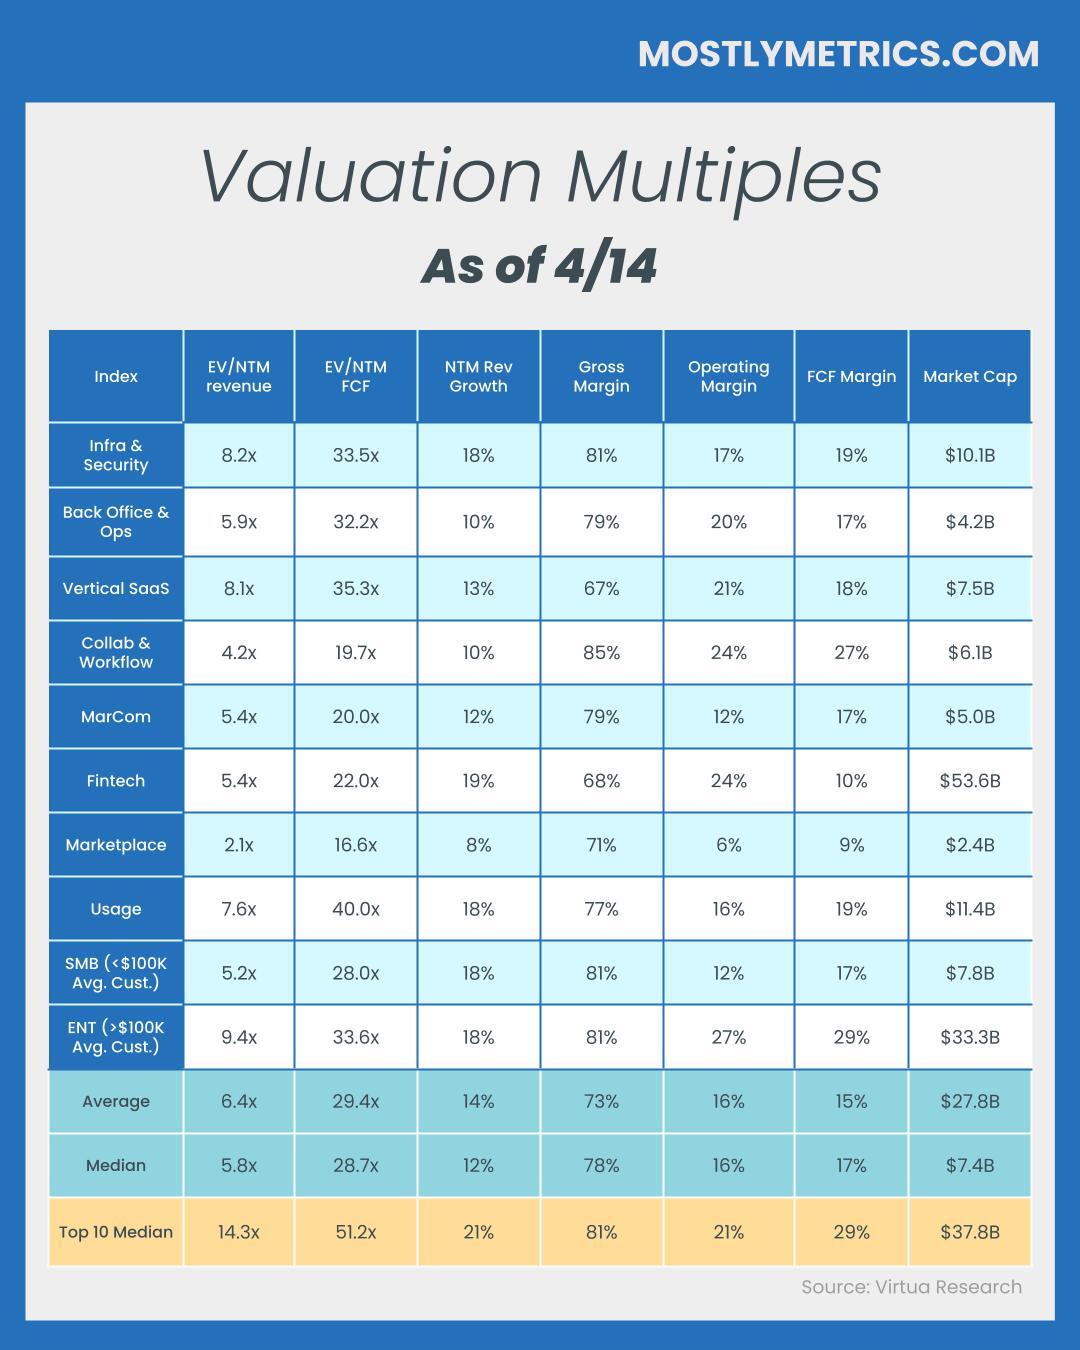
Figures for each index are measured at the Median
Average, Median, and Top 10 Median are measured across the entire data set, where n = 152
All margins are non-gaap
SMB is defined as average customer size below $100K in annual revenue
Enterprise is defined as average customer size above $100K in annual revenue
You can find the list of companies within each index here.
All definitions and formulas can be found here.
If you’d like the specific company level performance benchmarks used in these reports visit Virtua Research.
Revenue Multiples
Revenue multiples are a shortcut to compare valuations across the technology landscape, where companies may not yet be profitable. The most standard timeframe for revenue multiple comparison is on a “Next Twelve Months” (NTM Revenue) basis.
NTM is a generous cut, as it gives a company “credit” for a full “rolling” future year. It also puts all companies on equal footing, regardless of their fiscal year end and quarterly seasonality.

However, not all technology verticals or monetization strategies receive the same “credit” on their forward revenue, which operators should be aware of when they create comp sets for their own companies. That is why I break them out as separate “indexes”.
Reasons may include:
Recurring mix of revenue
Stickiness of revenue
Average contract size
Cost of revenue delivery
Criticality of solution
Total Addressable Market potential
From a macro perspective, multiples trend higher in low interest environments, and vice versa.
Multiples shown are calculated by taking the Enterprise Value / NTM revenue.
Enterprise Value is calculated as: Market Capitalization + Total Debt - Cash
Market Cap fluctuates with share price day to day, while Total Debt and Cash are taken from the most recent quarterly financial statements available. That’s why we share this report each week - to keep up with changes in the stock market, and to update for quarterly earnings reports when they drop.
Historically, a 10x NTM Revenue multiple has been viewed as a “premium” valuation reserved for the best of the best companies.
Efficiency Benchmarks
Companies who can do more with less tend to earn higher valuations.

Three of the most common, and consistently publicly available, metrics to measure efficiency include:
CAC Payback Period: How many months does it take to recoup the cost of acquiring a customer?
CAC Ratio is calculated as: (∆TTM Sales * Gross Profit Margin) / TTM S&M
CAC Payback Period is calculated as: (1 / CAC ratio) * 12
Note: Some may measure CAC Payback using the change in last quarter’s revenue x 4, but I believe this overstates a company’s progress if they are growing fast, and the output can be volatile due to quarterly sales seasonality. That’s why I look at it on a Trailing Twelve Month Basis.
Rule of 40: How does a company balance topline growth with bottom line efficiency? It’s the sum of the company’s revenue growth rate and free cash flow margin. Netting the two should get you above 40 to pass the test.
Rule of 40 is calculated as: Total Revenue Growth YoY % + Non Gaap Operating Profit Margin %
Non Gaap Free Cash Flow is calculated as: Net cash provided by operating activities, minus capital expenditures and minus capitalized software development costs.
Revenue per Employee: On a per head basis, how much in sales does the company generate each year? The rule of thumb is public companies should be doing north of $450k per employee at scale. This is simple division. And I believe it cuts through all the noise - there’s nowhere to hide.
Revenue per Employee is calculated as: (TTM Revenue / Total Current Employees)

A few other notes on efficiency metrics:
Net Dollar Retention is another great measure of efficiency, but many companies have stopped quoting it as an exact number, choosing instead to disclose if it’s above or below a threshold once a year. It’s also uncommon for marketplaces and fintechs to report it at all.
Most public companies don’t report net new ARR, and not all revenue is “recurring”, so I’m using annual change in TTM revenue timeframes as a proxy in my calculations. I admit this is a “stricter” view, as it is measuring change in net revenue, rather than gross revenue additions pre-churn.
Operating Expenditures
Decreasing your OPEX relative to revenue demonstrates Operating Leverage, and leaves more dollars to drop to the bottom line, as companies strive to achieve +25% profitability at scale.

The three most common buckets companies put their operating costs into are:
Sales & Marketing: Sales and Marketing employees, advertising, demand gen, events, conferences, tools
Research & Development: Product and Engineering employees, development expenses, tools
General & Administrative: Finance, HR, and IT employees… and everything else. Or as I like to call myself “Strategic Backoffice Overhead”

All of these are taken on a non Gaap basis and therefore exclude stock based comp, a non cash expense. SBC is still an important figure to track for total comp and dilution purposes, though.
A word from our sponsor Blue Rocket
A 1% change to your pricing plan can increase your bottom line by more than 10% 🤯.
The journey to price optimization is complex, but you don't have to navigate it alone.
BlueRocket's pricing experts have all operated companies before. And they’ve used that hands-on experience to help companies like Salesforce, Gitlab, Brex, Zendesk, and Google optimize their pricing.
Readers of this newsletter get a pricing audit with BlueRocket’s CEO Jason Kap.
All benchmarking data provided by Virtua Research.
For assistance with your own benchmarking and equity research needs, contact [email protected].
Tell him CJ sent you; he'll hook you up!"


