
Why does half the software built for CFOs look like it was designed in 2003… by someone who hates joy?
Finance teams deserve better.
Mercury gets it. They built a banking* experience that’s actually enjoyable (speaking as a customer here). It’s clean. It’s powerful. It works.
Not only does Mercury offer banking* — it also offers financial software with smart workflows, tactical tools, and useful templates.
Speaking of templates…Mercury’s own CFO, Daniel Kang, is sharing his personal forecast model — the one he’s used to raise capital, update the board, and guide ops.
Whether you’re prepping for a fundraise, revising plans, or just making sense of the madness, this model will help you align your team, clarify goals, and communicate with confidence.
*Mercury is a financial technology company, not a bank. Banking services provided through Choice Financial Group, Column N.A., and Evolve Bank & Trust; Members FDIC.
There are lots of ways to make a buck in this world, outside of just slingin’ tech.
I sat next to a CFO at dinner recently. I asked her what her company did. HVAC.
CJ: “Ok, so you make the HVAC systems that pump the hot or cool air in?”
CFO: “Well, kind of. We make the small parts that hold the HVAC systems together.”
CJ: “Like the belts and bolts and stuff?”
CFO: “Exactly.”
CJ: “Business doing well?”
CFO: “You bet. We’ll do about one-one, one-two in revenue this year.”
CJ: “Million?”
CFO: “No, billion.”
CJ:
If you live, eat, and breathe tech (guilty), it can feel like software really did eat the world. But zoom out, and there's a whole whack of billion-dollar businesses that aren’t propped up by net retention dashboards or subscription graphs. They’re just much quieter (and don’t have Substacks).
At another dinner this week, I sat next to a CFO I actually recognized — she runs finance at a popular subscription dating app. We started nerding out over retention, DAUs, churn curves. Classic SaaS banter.
She paused, taking a sip of her Cosmo, and said:
“You know, it’s funny. We think we’re so smart with all these metrics. My husband and I met a guy on vacation who rips and replaces dirty rugs in Georgia public schools.
Paid himself $22 million last year.”

There’s a fantastic musing making the rounds:
“When God gives you a blank canvas, why do you paint B2B SaaS?”
Sometimes I wonder if the greatest trick the devil ever played was convincing us that SaaS revenue was more noble, more scalable, more defensible than the alternatives. That it was infinitely extensible (whatever that means), with durable gross margins.
Now, I say this as someone who benefits from this ecosystem (and who puts those exact words on pptx slides). I’m like, all in. But let’s say the quiet part out loud: the SaaS model only works if we keep reinvesting. You don’t get to “build it once and sell it forever.”
If you really think that’s true, go back to bed. It’s a fairy tale.
You build it, maintain it, patch it, rebuild it, then build some more - just to keep customers from churning.
“The uncomfortable answer, I think, is that software margins—and especially SaaS margins—are an accounting fiction…
Software development costs are COGS. Not literally; not according to the accountants. But in practice, if you can only sell SaaS software—and retain customers—by promising a steady stream of new releases, how are the expenses associated with developing those releases functionally any different than the money you spend on servers and support agents?”
Retention isn’t free; it’s funded. It’s propped up by R&D line items that live in OPEX and get pitched as growth bets, even when half the roadmap is just fixing old shit we shipped too fast. Yet we church it up like we’re death wrestling ogres.

There’s still real value in what we do. That is not what I’m saying at all. I’d rather close the books using software than an abacus. I’d rather ask ChatGPT for directions on how to stain the back deck than call my father in law. I’m not questioning the innovation or the efforts. But we should interrogate the pedestal we put our business models on. We’re not necessarily smarter than the rug guy. We’re just more convincing… at pitching the dream to ourselves, our boards, and the next buyer on the cap table.
And sure, some companies make the math work. They reach the promised land. Microsoft and Adobe got there. They graduated up and through Maslow’s hierarchy of software needs. A handful of others, while smaller, can be found under a Constellation Software umbrella, quietly chugging along in a vertical SaaS niche no one else wants to touch.
But most? Most of us are still feeding the beast.

So maybe next time I find myself obsessing over expansion revenue or CAC payback, which will eventually maybe get better someday, I’ll remember the guy with the rug business.
Not to idolize him, or to put down my own efforts (I have a fragile ego), but to remind myself that value comes in more shapes than one. And sometimes, the most durable margin is the one that doesn’t need a pitch deck to explain.
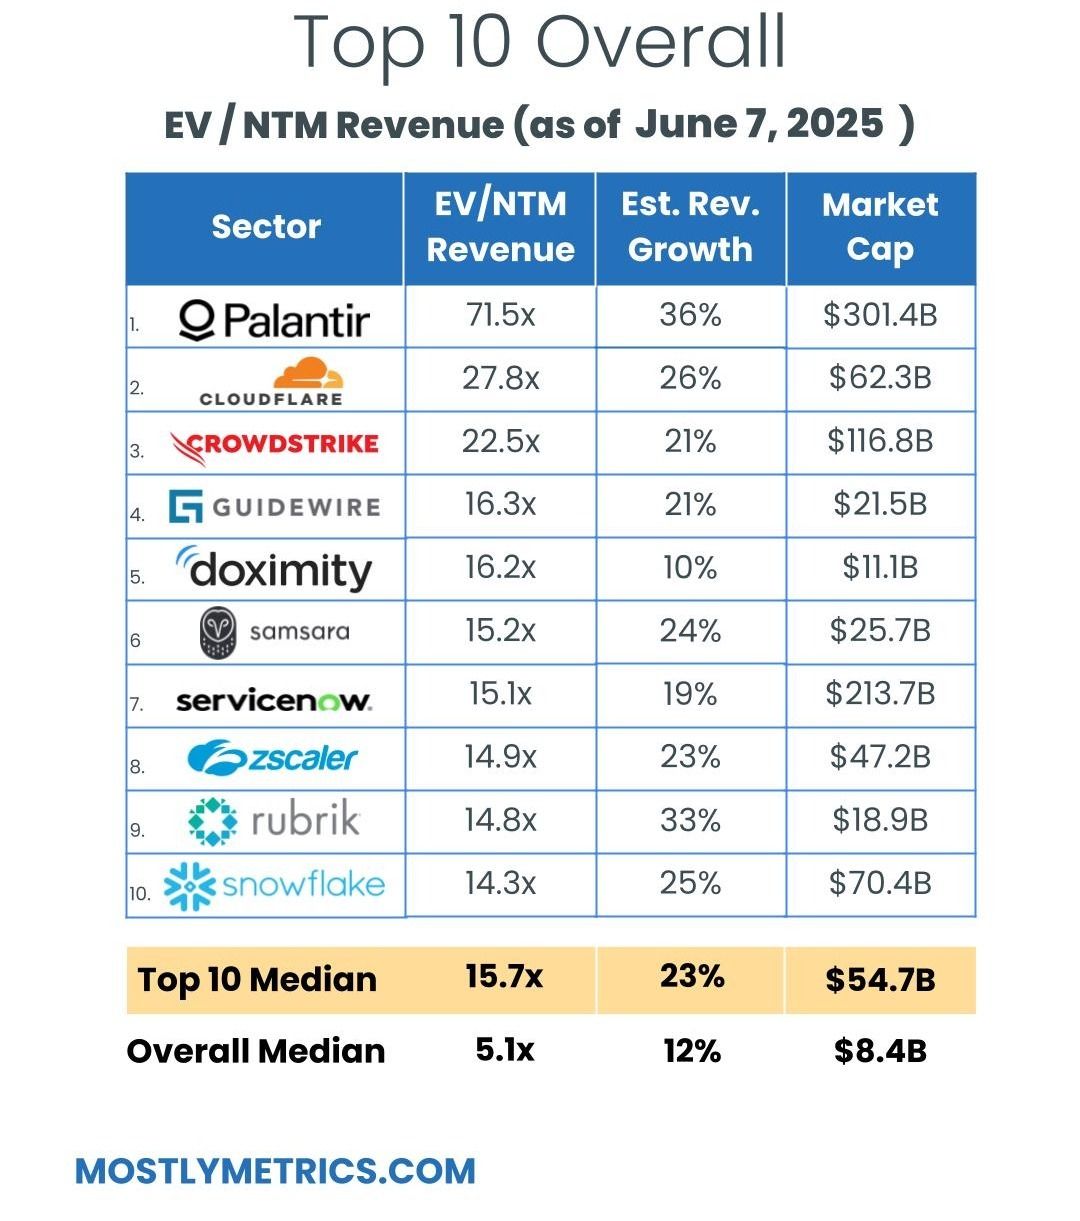
TL;DR: Multiples are UP week-over-week.
Top 10 Medians:
EV / NTM Revenue = 15.7x (UP 0.4x w/w)
CAC Payback = 30 months
Rule of 40 = 50%
Revenue per Employee = $405k
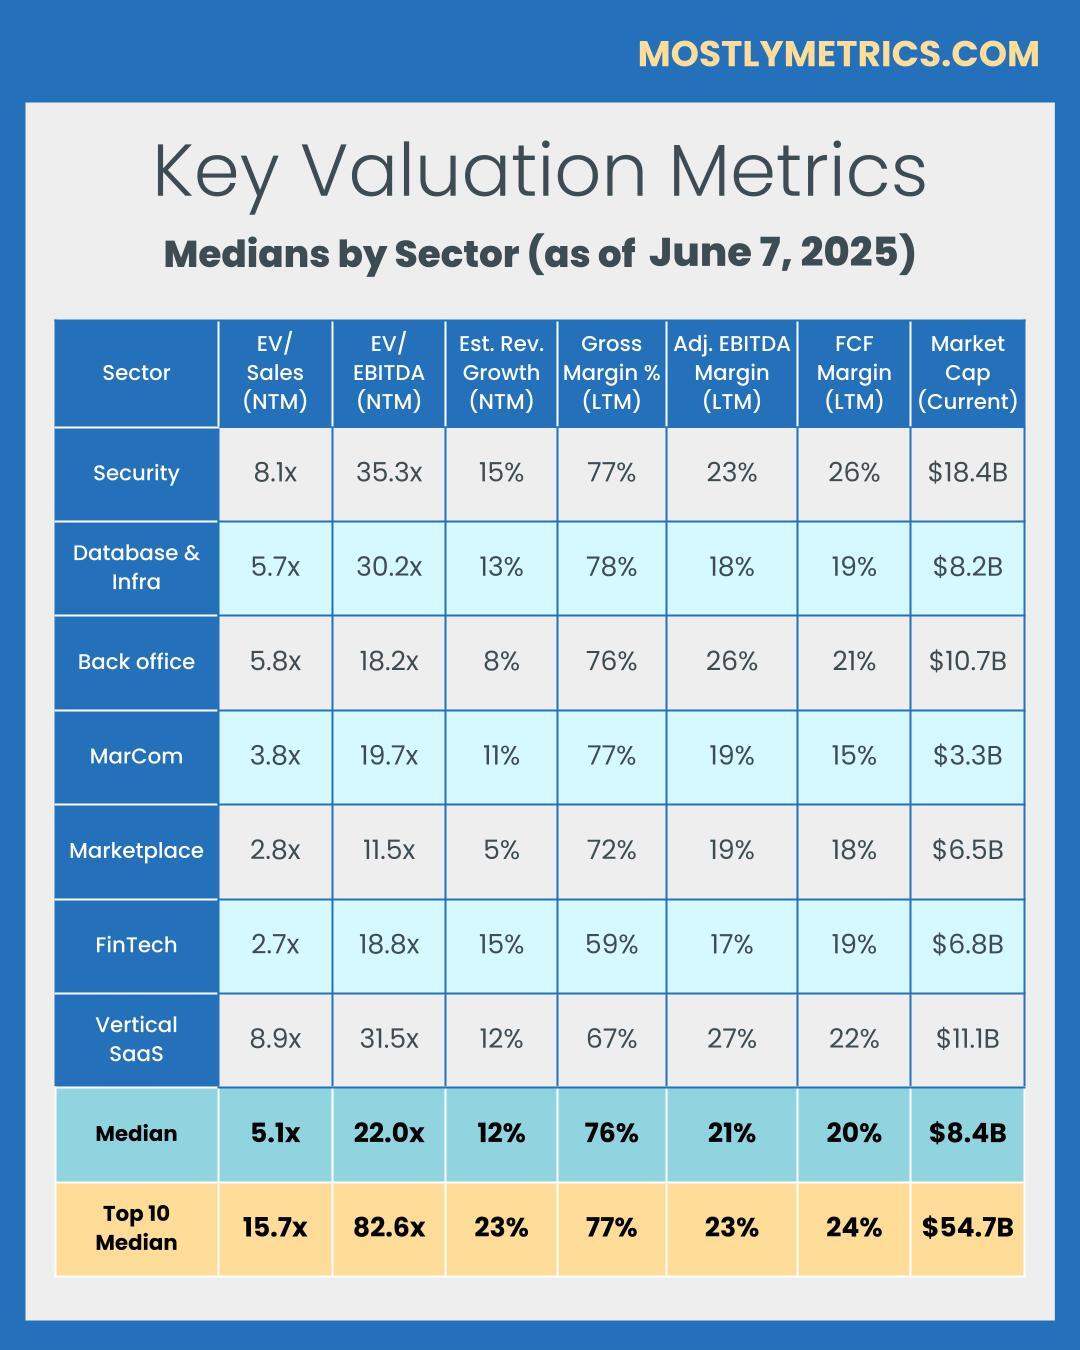
Figures for each index are measured at the Median
Median and Top 10 Median are measured across the entire data set, where n = 111
Population Sizes:
Security: 18
Database and Infra: 14
Backoffice: 16
Marcom: 16
Marketplace: 15
Fintech: 16
Vertical SaaS: 16
Revenue Multiples
Revenue multiples are a shortcut to compare valuations across the technology landscape, where companies may not yet be profitable. The most standard timeframe for revenue multiple comparison is on a “Next Twelve Months” (NTM Revenue) basis.
NTM is a generous cut, as it gives a company “credit” for a full “rolling” future year. It also puts all companies on equal footing, regardless of their fiscal year end and quarterly seasonality.
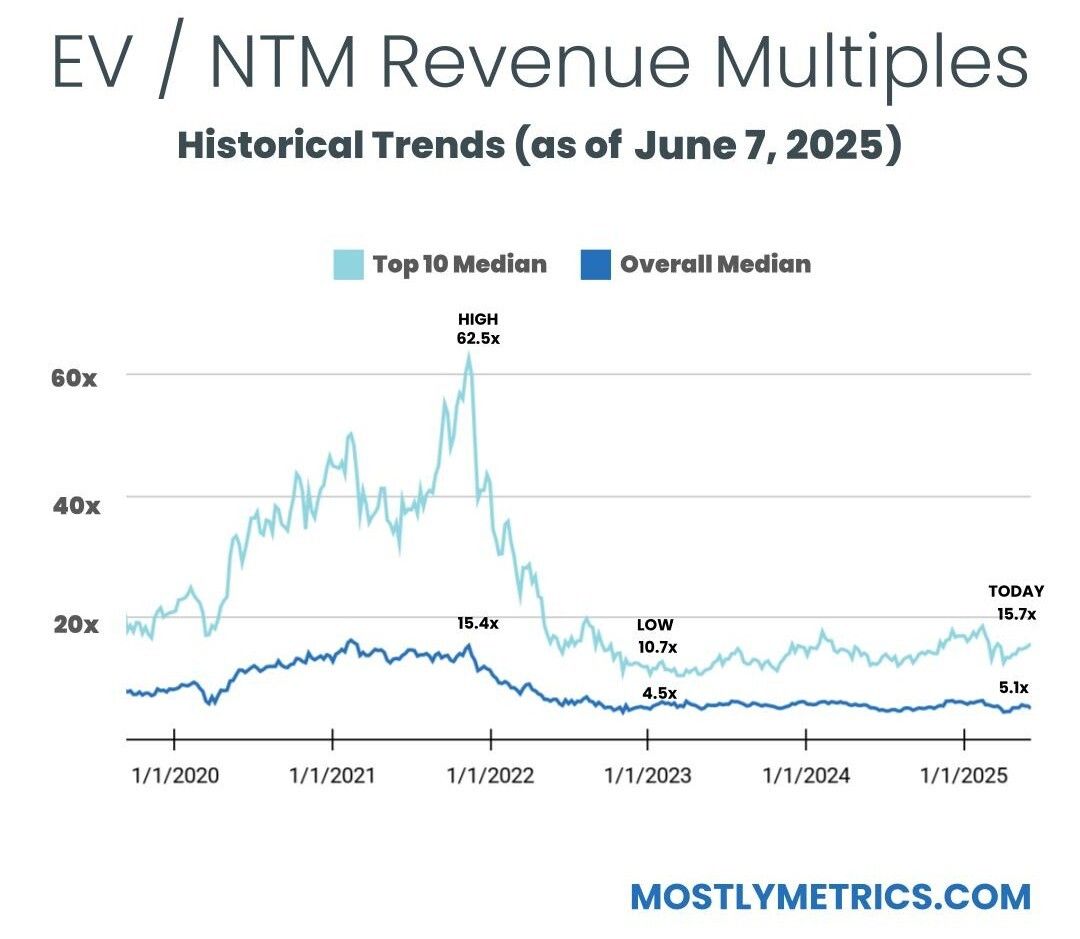
However, not all technology sectors or monetization strategies receive the same “credit” on their forward revenue, which operators should be aware of when they create comp sets for their own companies. That is why I break them out as separate “indexes”.
Reasons may include:
Recurring mix of revenue
Stickiness of revenue
Average contract size
Cost of revenue delivery
Criticality of solution
Total Addressable Market potential
From a macro perspective, multiples trend higher in low interest environments, and vice versa.
Multiples shown are calculated by taking the Enterprise Value / NTM revenue.
Enterprise Value is calculated as: Market Capitalization + Total Debt - Cash
Market Cap fluctuates with share price day to day, while Total Debt and Cash are taken from the most recent quarterly financial statements available. That’s why we share this report each week - to keep up with changes in the stock market, and to update for quarterly earnings reports when they drop.
Historically, a 10x NTM Revenue multiple has been viewed as a “premium” valuation reserved for the best of the best companies.
Efficiency Benchmarks
Companies that can do more with less tend to earn higher valuations.
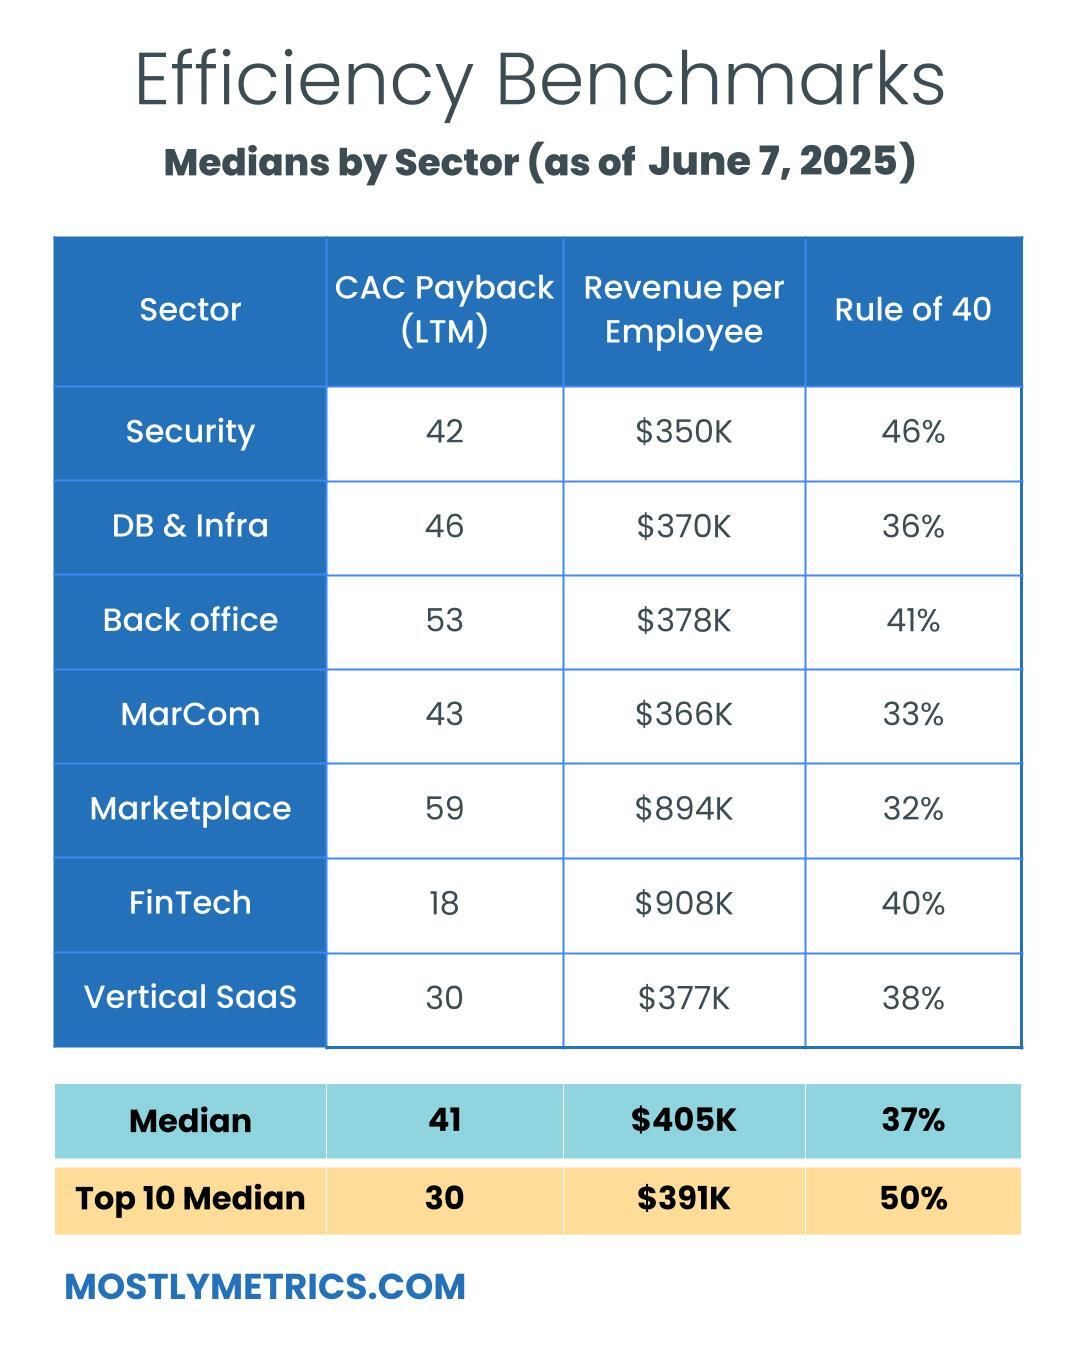
Three of the most common and consistently publicly available metrics to measure efficiency include:
CAC Payback Period: How many months does it take to recoup the cost of acquiring a customer?
CAC Payback Period is measured as Sales and Marketing costs divided by Revenue Additions, and adjusted by Gross Margin.
Here’s how I do it:
Revenue per Employee: On a per head basis, how much in sales does the company generate each year? The rule of thumb is public companies should be doing north of $450k per employee at scale. This is simple division. And I believe it cuts through all the noise - there’s nowhere to hide.
Revenue per Employee is calculated as: (TTM Revenue / Total Current Employees)
Rule of 40: How does a company balance topline growth with bottom line efficiency? It’s the sum of the company’s revenue growth rate and EBITDA Margin. Netting the two should get you above 40 to pass the test.
Rule of 40 is calculated as: TTM Revenue Growth % + TTM Adjusted EBITDA Margin %
A few other notes on efficiency metrics:
Net Dollar Retention is another great measure of efficiency, but many companies have stopped quoting it as an exact number, choosing instead to disclose if it’s above or below a threshold once a year. It’s also uncommon for some types of companies, like marketplaces, to report it at all.
Most public companies don’t report net new ARR, and not all revenue is “recurring”, so I’m doing my best to approximate using changes in reported GAAP revenue. I admit this is a “stricter” view, as it is measuring change in net revenue.
Operating Expenditures
Decreasing your OPEX relative to revenue demonstrates Operating Leverage, and leaves more dollars to drop to the bottom line, as companies strive to achieve +25% profitability at scale.
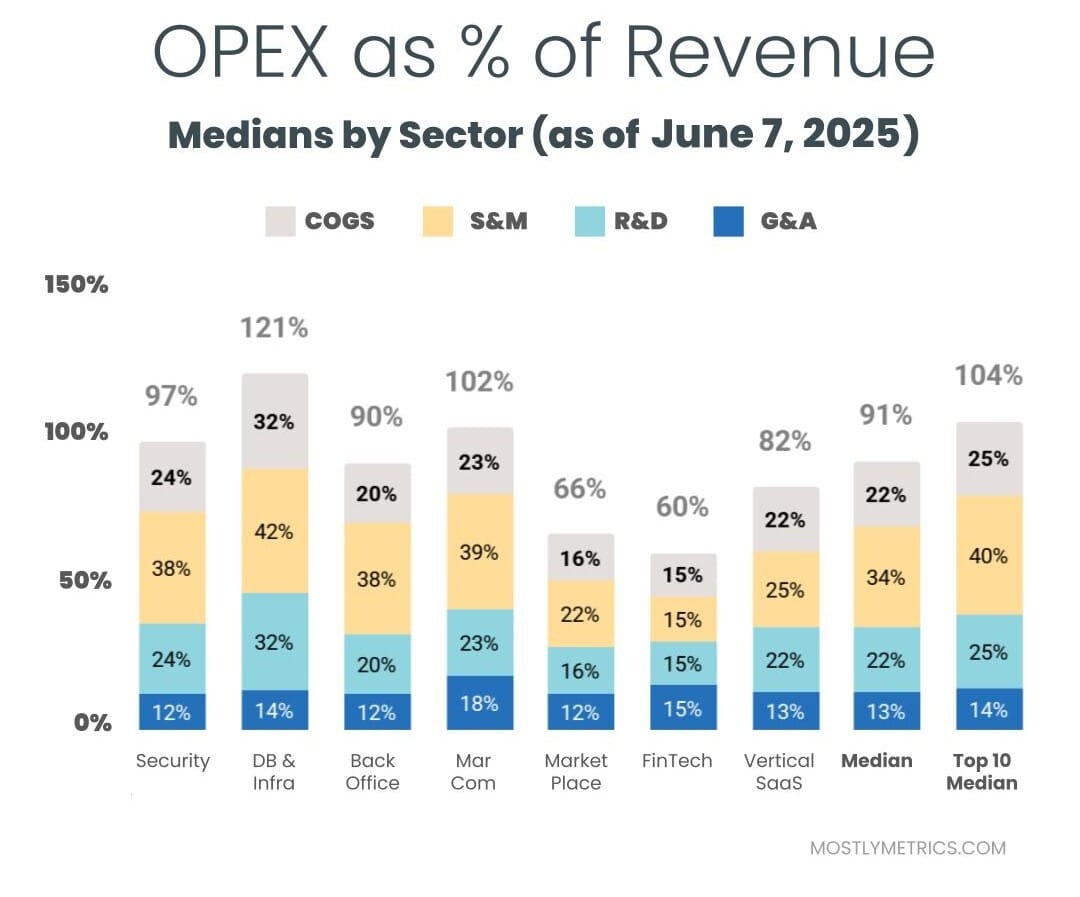
The most common buckets companies put their operating costs into are:
Cost of Goods Sold: Customer Support employees, infrastructure to host your business in the cloud, API tolls, and banking fees if you are a FinTech.
Sales & Marketing: Sales and Marketing employees, advertising spend, demand gen spend, events, conferences, tools.
Research & Development: Product and Engineering employees, development expenses, tools.
General & Administrative: Finance, HR, and IT employees… and everything else. Or as I like to call myself “Strategic Backoffice Overhead.”
All of these are taken on a Gaap basis and therefore INCLUDE stock based comp, a non cash expense.
