After 15 years in tech finance, I've learned that your banking partner can make or break your growth strategy.
MUFG — the $3 trillion Japanese bank —has purpose-built its Growth & Middle Market Technology Practice to deliver strategic banking for ambitious tech companies that need more than a transaction. These are 50 of the best tech bankers in North America and Europe who speak the language of high-growth companies, with a mission to support them no matter how global and complex they get.
Global resources. Startup-caliber insights.
Contact Group Head Bob Blee ([email protected]) to discuss how MUFG is empowering a brighter future for the tech ecosystem.

Figma IPO: S-1 Breakdown
From multiplayer design tool to the OS for digital product creation.
It’s here.
Figma filed to go public in April of this year and left nerds like me refreshing the SEC.gov archives for two months like a cat in heat. But the wait was well worth it.
This company is the strongest IPO of the year.
Founded in 2012, the company started as a web-based design tool and evolved into a broader collaboration platform used by designers, PMs, and engineers to build digital products from scratch. It’s what happens when the design file becomes the product spec, whiteboard, and roadmap… all in one.
Some key numbers from the filing:
(warning: don’t read while operating heavy machinery or pouring milk):
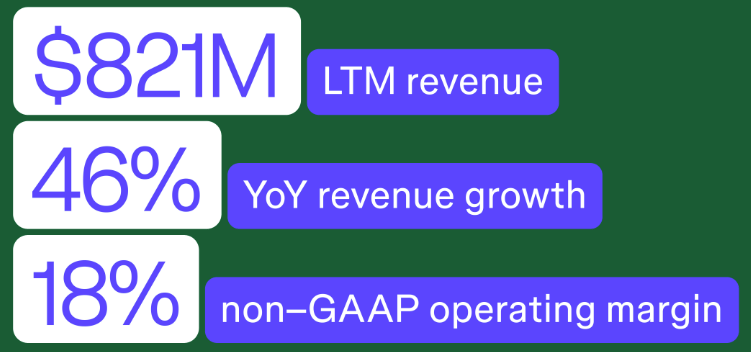
Revenue:
ARR: $912M, +46% y/y (Q1’s $228M x 4)
LTM gaap: $821M, +46% y/y growth
FY24 gaap: $749M, +48% year-over-year
Gross Margin: 88% in 2024
Net Income (Q1 2025): $45M, up from $14M in Q1 2024
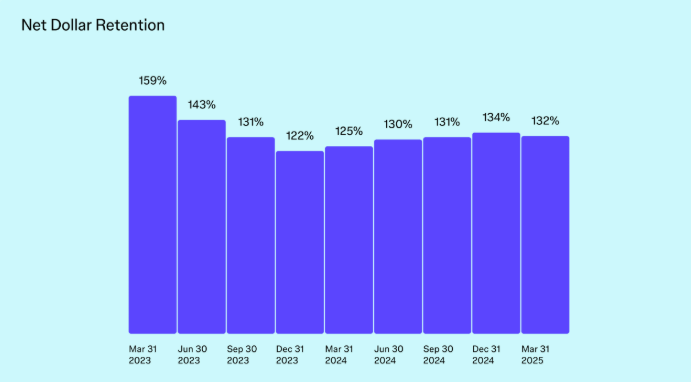
Net Dollar Retention Rate: 132% as of March 2025
13M+ Monthly Active Users, with ⅔ being non-designers
Bonkers that more than half of their active users are NOT their initial ICP
That means for every 1 designer they get, 2 others from elsewhere in the org get sucked into the orbit!
Figma’s journey has been uniquely shaped by its viral bottoms-up motion. They are the golden child of PLG.
And if you’re like me, you’ve experienced it in action: one designer sharing a URL inside a company often kicks off the adoption curve. Next thing you know, the CFO and the entire FP&A team mysteriously have licenses raking in $15 / month / user.
Its failed acquisition by Adobe, which resulted in a $1B breakup fee, gave Figma extra cash and extra notoriety back in 2022. The company used that momentum to launch a suite of new products in 2024 and 2025 that move it closer to becoming a full-stack platform for digital product development. And boy, did they keep compounding.
What Figma Does
It started with design files. Now it’s building the OS for product teams.
Figma was founded on a simple insight: design should happen in the browser, and in multiplayer mode — not in isolation on your desktop (or worse, PPTX). The core product — Figma Design — lets teams collaboratively build user interfaces in real time, using only a web link to share work.
Over the past four years, Figma has expanded beyond UI design to support the full product development lifecycle. The platform now includes:
FigJam – a digital whiteboard for brainstorming and mapping user flows
Dev Mode – a workspace for engineers to inspect designs and pull production-ready code
Figma Slides – presentation software designed to keep product teams aligned
Figma Sites – turn designs into live websites, no handoff needed
Figma Buzz, Draw, Make – new tools for asset creation, fine-grained vector editing, and AI-powered prototyping
The pitch is clear: one platform to ideate, design, build, and ship. As of Q1 2025, 76% of customers used two or more Figma products, up from 64% a year earlier.
The product strategy leans heavily into extensibility (vocab word!). Over 10,000 community-built plug-ins and widgets sit on top of Figma’s API layer, making the product sticky across roles and teams.
And you see that stickiness play out in their incredible retention rates below.

How They Make Money
Butts in seats — priced by role, scaled by collaboration.

Figma’s growth starts at the grassroots. Designers sign up individually, invite teammates into their files, and soon the design org — and eventually the broader product team — is collaborating in multiplayer mode. That bottoms-up adoption flows into a more traditional sales motion, with a direct sales team focused on upselling to Organization and Enterprise plans. As of Q1 2025, those top-tier plans accounted for 70% of total revenue.

Importantly, 70% of those larger deals started with a user on a Professional plan, highlighting the strength of Figma’s viral loop. A shared link is often the first step in a multi-year customer lifecycle.
Figma monetizes via a per-seat, per-month subscription model. Customers can choose between annual and monthly billing, with pricing tiers based on scale and administrative features:
Starter – free tier for personal use
Professional – for individuals and small teams
Organization – centralized workspaces and admin tools
Enterprise – advanced compliance, governance, and SSO
More recently, Figma has layered in role-based seat types to better monetize cross-functional teams:
Full Seat – access to the full suite: Design, FigJam, Dev Mode, Slides, etc.
Dev Seat – optimized for engineers with Dev Mode and Code Connect
Content Seat – geared toward marketers using Buzz, Slides, and Sites CMS
Collab Seat – for lighter-touch users collaborating in Slides and FigJam
Viewer Seat – free, comment-only access to enable seamless sharing

This pricing architecture unlocks revenue from previously non-paying personas. As of Q1 2025, developers made up 30% of monthly active users, and many are now monetized through Dev Seats.

Looking ahead, Figma hinted at potential non-seat-based pricing, especially for newer SKUs like Figma Make and Figma Sites. These products are still in beta and not yet fully monetized — but represent a path to expanding ARPU without adding headcount.
Beyond monetization, Figma invests heavily in community. It supports over 200 Friends of Figma chapters globally and hosts Config, its annual user conference, which has become a fixture in the product and design calendar. Developer / PM evangelism is a playbook we’ve seen multiple tech companies take to the bank, like Gitlab, Docker, and Atlassian.
Financial Profile
High growth. High margin. Actually profitable.
Figma ended 2024 with $749M in revenue, up 48% year-over-year from $505M in 2023. The company has carried that momentum into 2025, generating $228M in Q1 revenue, a 46% increase over Q1 2024. That clocks in at $912M in ARR.
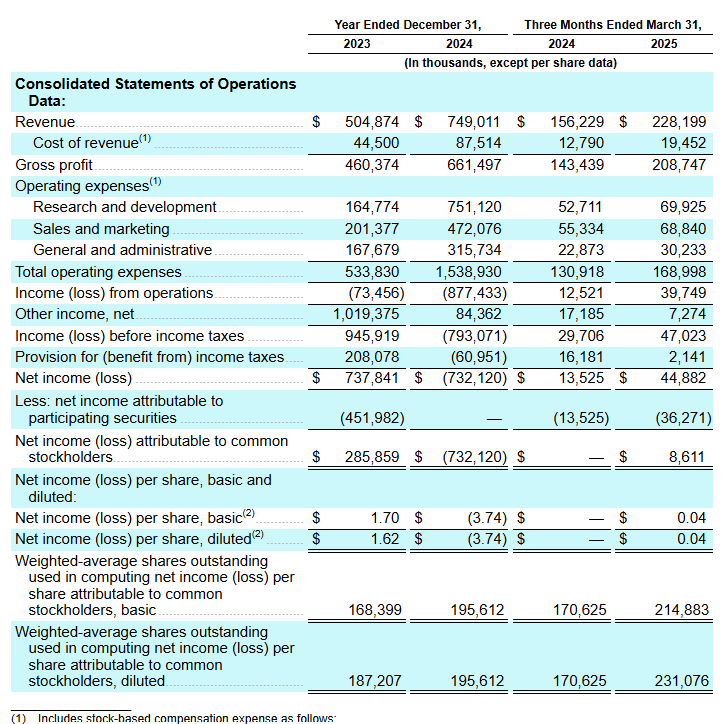
Margins reflect the efficiency of a browser-based, product-led business:
Q1 2025 Gross Margin: 88%
Q1 2025 Operating Margin: 17%
Q1 2025 Net Income: $45M (up from $14M in Q1 2024)
Q1 2025 Operating Income: $40M
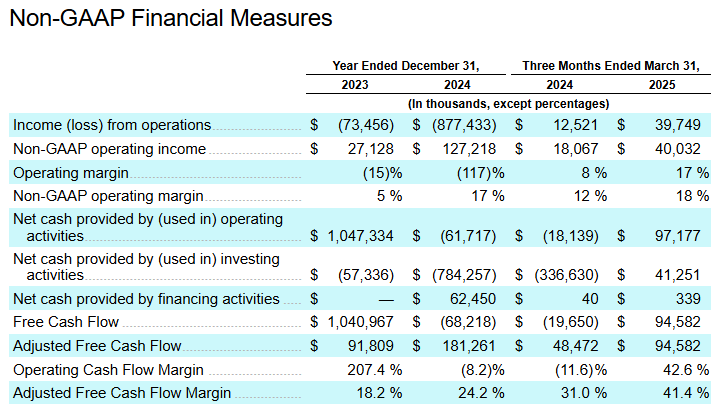
Figma's Rule of 40 score in Q1 2025 was 63 (46% revenue growth + 17% operating margin) — well above the SaaS benchmark of 40.
If we look at their March 24 vs March 25 spend by category
R&D growing at 33% y/y
S&M growing at 24% y/y
G&A growing at 32% y/y (normal jump to see in an IPO year)
Notably, they are all growing slower than revenue, demonstrating operating leverage.
The company’s 2024 net loss of $732M was driven almost entirely by $889M in one-time stock-based comp related to the terminated Adobe acquisition. When you’ve been around since 2012, you’ve got a lot of stock sitting on your books. Stripping out that noise reveals a business with real and consistent profitability.
SaaS Metrics

Net Dollar Retention (NDR): 134% in 2024; 132% as of Q1 2025
13M+ Monthly Active Users, with ~30% being developers and ~⅔ non-designers
Organization + Enterprise Plans: 70% of total revenue
~70% of enterprise deals originated from individual users on Professional plans
These numbers suggest a strong land-and-expand engine, backed by both viral usage and a seasoned enterprise sales motion.

Capital Position
Cash on Hand (Q1 2025): $463M
Debt: None disclosed
Cap Table Benefit: $1B Adobe breakup fee provided runway for product expansion and hiring

Expansion Areas
Figma is only starting to monetize newer SKUs like Make, Buzz, and Sites — all still in beta as of the filing. Future monetization could also include non-seat-based pricing (e.g. usage-based or feature-tiered billing).
International markets remain underpenetrated. While specific revenue breakdowns weren’t disclosed, the company highlights global expansion as a core pillar of growth going forward.
Valuation, Investors, and Ownership
A cap table full of heavyweights.
This stat blew my mind - a remarkable six institutional investors will make north of $1 billion in proceeds, assuming the company eclipses the $20 billion valuation mark.

That puts Field’s stake at ~$1.58B on paper, and Index’s at ~$3.7B.
Risks and Open Questions
Not everything is editable.
Figma looks strong on paper — but a few headwinds and unknowns are worth watching:
Enterprise Expansion Limits – 95% of the Fortune 500 already use Figma, but only 1,042 customers pay >$100K/year. Can they make $500K+ whales out of their existing $100K marlin (IDK it’s late at night at this point and I can’t think of another mid-sized fish)?
Feature Commoditization & Competitive Pressure – Real-time collaboration is now table stakes. Microsoft, Canva, Adobe XD, and Notion are all pushing into similar product territory. Miro and Canva also operate in tangential spaces and are really good at what they do.
AI: Opportunity or Cannibal? – New tools like Buzz, Make, and Sites look great in the S-1, but do they expand the TAM or shrink seat count? Can Figma monetize AI without undermining its core seat-based model?
Seat Fatigue & Pricing Evolution – As the product spreads beyond designers, can Figma keep layering on monetized roles (PMs, engineers, marketers)? Or will CFOs start pushing back?
International Growth Gap – The company has strong global usage, but only ~20% of revenue comes from outside the U.S. Can they close the monetization gap with a scaled GTM engine?
Governance Overhang – Dylan Field holds 15:1 super-voting shares plus a proxy over his co-founder’s stake. Will long-term investors be comfortable with one-man control?
Cash Usage Discipline – With $463M in the bank and no clear M&A roadmap, what exactly will they do with IPO proceeds? The balance sheet doesn’t need the money.
Valuation Scenarios
What might Wall Street pay for browser-based design at scale?
Let’s apply a range of public SaaS revenue multiples to that number:
LTM Revenue: $821M
Assumed FY25 Growth: 35%
Implied FY25E Revenue: ~$1.1B
NTM Revenue Multiples Applied:

Rule of 40: 63 (Q1 2025)
Top Ten Median in terms of valuation only clock in at 50
Gross Margin: 88%
Profitability: Net income of $45M in Q1
NDR: 132%
Cash: $463M, no debt
Valuation anchor: Adobe’s blocked $20B offer
Read:
At 15x forward revenue, Figma lands around a $17B valuation — which looks reasonable for a business with elite retention, margin, and growth.
But I think 20x is warranted. Their financials are rock solid.
15x feels more like the baseline, and 25x feels like the immediate upside.
$22B to $27B feels like a rich, but earned and logical range out of the gates.
Final Take
Revisionist history, but it’s now clear that if the Adobe merger had gone through, they wouldn’t have over kicked their coverage and overpaid. Figma has continued to compound greatness.
Figma is a SaaS standout: browser-native, product-led, and actually profitable. It checks the Rule of 40 box, boasts best-in-class margins, and has a clear runway for multi-product growth.
It will be priced like a generational winner. And to justify the valuation, Figma has to show that it’s more than a design tool — and that it can keep expanding into new functions, markets, and monetization models without losing the simplicity that made it great.
This isn’t a bet on revenue multiples. It’s a bet on a new category of productivity software, one that spans multiple teams and becomes the operating system for how product is made.
None of this is investment advice. I write it at a kitchen counter that’s v sticky with ice-cream from my three year old. Do your own homework.
