👋 Hi, it’s CJ Gustafson and welcome to Mostly Metrics, my weekly newsletter where I unpack how the world’s best CFOs and business experts use metrics to make better decisions.

“Chime serves everyday working adults making up to $100K… who live paycheck to paycheck.
Chime isn’t trying to serve everyone. It’s built for the 70% of Americans who don’t keep high balances — and have been underserved, or straight up penalized, by traditional banks.”
💸 Quick Stats
2024 Revenue: $1.67B (+31% YoY)
What Chime actually kept to run the business — swipe-driven, not interest-bearing.
Purchase Volume: $115.2B (+27% YoY)
Total throughput — shows scale and frequency of user engagement.
Revenue is growing 4% faster than purchase volume
Suggests an increased take rate at scale and / or additional product adoption
Active Members: 8.6M (+23% YoY)
Defined as a member who completed a money movement activity in the last calendar month.
Primary Account Relationships: 67%
Defined as either 15+ card transactions or a direct deposit of $200+.
This is the holy grail — Chime’s “you trust us with your paycheck” moment.
Average Revenue per Active Member (Q1 2025): $251 (annualized)
Quarterly Revenue / Active Members x 4
Transactions per Member (Q1 2025): 54 / month
Chime is the top-of-wallet card for members — this is the metric that proves it.
Gross Margin: 88%
Includes transaction processing, bank partner fees, card/ATM network costs — and net of volume-based rebates.
Adj. EBITDA Margin (Q1 2025): 5%
Nothing sketchy here — mostly standard SBC and non-core cleanup.
Net Income (Q1 2025): $13M (2% margin)
Technically profitable, but thin.
Public market investors will want to see leverage improve.
Transaction Margin (Q1 2025): 67%
Down from 79% YoY — the MyPay launch juiced revenue, but also juiced credit losses.
Net Dollar Transaction Profit Retention (TTM): 104%
A swipe-economics version of NDR — captures:
Growth in per-user transaction volume
Margin gains via ChimeCore
Churn offsets
Translation: older cohorts are getting more profitable, not less.
Note: Excludes credit loss new revenue from MyPay
Fun Fact: In 2024, Chime-branded debit card spend volume was only surpassed by five issuers nationwide.
Tagline I Made Up But They Should Steal: “Chime gets paid when you swipe — not when you stumble.”

($33m over 3 years for Mavs jersey patches 🔥. Risk factors section of S1 absent of any mention of Luka trade 👀.)
What They Do
Chime isn’t a bank. They just look like one from the front.
Technically, Chime is a consumer fintech platform that wraps intuitive UX and product features around traditional banking infrastructure. Behind the scenes, FDIC-insured bank partners like The Bancorp Bank and Stride Bank hold customer funds, issue cards, and manage regulatory compliance.
Chime owns the customer relationship, product roadmap, and experience — from mobile app to customer support. They’re the full-stack front-end, the program manager, and the brand. The banks are the balance sheet. It’s a neat split: banks do what they’re good at (lending, compliance), and Chime does what it’s good at (product, marketing, fraud mitigation).

The model is asset-light, capital-efficient, and importantly — doesn’t require Chime to hold deposits or underwrite credit risk directly on their balance sheet.
Zooming out: This structure is born out of a decades-long trend in U.S. retail banking. The top four banks now hold over 50% of domestic deposits, largely through consolidation and branch sprawl. For small and mid-sized banks, partnering with a tech-forward platform like Chime is a way to tap into new deposit flows without spending big on consumer marketing or product development. They can scoop up portfolios of consumer deposits at scale.
For Chime, it means scaling without a charter.
Chime is a product of a banking system that consolidated power at the top and hollowed out the middle. Small banks can’t afford to compete on customer acquisition — so they rent Chime’s front-end to get access to deposits (which they then lend out off their own balance sheet).
This “we’re not a bank, but we act like one” play has helped Chime become the #1 brand for direct deposit switches among adults earning “up to $100K annually” (this phrase is mentioned 29 times in the S1 filing). That’s not just slick branding — it’s distribution muscle paired with a real pain point: traditional banks don’t want the low-balance customer, but Chime built a business around serving them profitably.
TL:DR:
Chime: Owns the customer, builds the product, takes the fraud risk
Partner Banks: Hold the money, issue the cards, stay FDIC compliant
💳 How They Make Money

As Chime’s CFO described to me on the podcast, Neobanks might all look similar on the outside, but under the hood, there are a few tried and true ways to make money in this game. Here are the four most common models:
Lending / Spread – You act like a traditional bank: take deposits, lend them out, earn the difference
Subscription Fees – Charge users for premium tiers or bundled perks
Payments / Interchange – Earn a cut of every card swipe
Float Income – Park customer deposits in interest-bearing accounts and pocket the spread (only works when rates are high)
Some neobanks try to do all of these. But most lead with one. Chime is an interchange business. They are firmly in the #3 category above.
That means the lion’s share of Chime’s revenue comes from card payments — specifically the small fee merchants pay every time a Chime member swipes their debit or credit card. The interchange rate is set by the card networks (Visa, Mastercard) and regulated by the government.
Here’s the simplified flow of who gets paid:
The merchant pays the interchange fee
The card network takes a cut
The issuer (usually a bank) takes the biggest chunk
Chime, through its partnerships with banks like The Bancorp and Stride, gets a meaningful share — even though it’s not technically the issuer
This works because Chime is the one doing the heavy lifting: building the app, acquiring the users, running fraud and support. The banks handle the regulatory plumbing.
It’s an elegant, asset-light model, but it only works if two things are true:
You have top-of-wallet status. In Q1 2025, Chime users averaged 54 transactions per month, mostly on non-discretionary categories like groceries, gas, and utilities.
You keep costs low. Chime’s digital-only structure means no branches, and 68% of support tickets are resolved without human interaction. Between 2022 and 2025, they cut support costs per user by 60% and reduced fraud losses by 29%.
Unlike fee-driven models (maintenance charges, overdrafts) or subsidy-based growth (buy now, lose later), Chime’s monetization engine is built on trust and usage. If you get a customer to route their paycheck to Chime — a move they don’t make lightly — you win recurring swipe volume and the right to cross-sell higher-value products like Credit Builder, MyPay, or Chime+.

That’s why they don't charge overdraft fees. That’s why they don’t need to push subscriptions. Chime’s incentive is aligned with the member: they win when people swipe, not when people slip.

“The increasing focus on the wealthy customer had led to a two-tier banking system in our country. And the majority of Americans found themselves in the lower tier - with a banking relationship that profits by penalizing them.
Again, this isn’t a small subset of people. 75% of American earn up to $100,000 a year. This is the heart and soul of our country.
So how did we get here? The reality is that most Americans don’t have large deposits. Two-thirds live paycheck-to-paycheck, and far too many are considered unworthy in terms of credit quality. For traditional banks - with balance sheet driven, lending business models and costly physical footprints - this mean most Americans were undesirable to them. The only way for them to serve them profitably? A heavy focus on fees.”
📊 Unit Economics
Let’s talk throughput. Chime’s model hinges on volume, retention, and cost control — and their metrics tell the story of a neobank that’s figured out how to scale without melting its servers or its margins.

Here’s what stands out:
Active Members: 8.6M as of March 31, 2025 (+23% YoY)
Primary Account Relationships: 67% — defined as members who route their paycheck or use Chime for 15+ transactions a month
ARPAM (Q1 2025): $251 (annualized) — up from $231 in Q1 2024
Purchase Volume: $115.2B in 2024 — up 27% YoY
Transactions per Member: 54 / month on average in Q1 2025
Non-Discretionary Spend: 70% of purchase volume goes to essential categories like groceries, gas, and utilities
Product Attach Rate: 3.3 products per Active Member
Net Dollar Transaction Profit Retention: 104% — meaning revenue from older cohorts actually grows over time
Support Efficiency: 68% of support interactions resolved without human intervention
Fraud Loss Rate: Down 29% from 2022 to 2025
Support Costs per Member: Down 60% over the same period
These numbers paint a picture of a platform with daily utility. Chime isn’t just an app people download and forget — it’s where their paychecks land, where they swipe for gas, where they overdraft for free, and where they build credit. It’s the hub.
And once Chime earns that trust (read: that direct deposit), everything else — SpotMe, MyPay, Credit Builder, Chime+ — becomes much easier to layer on.
While Chime hasn’t disclosed exact Customer Acquisition Cost figures, they noted that referrals remain their largest acquisition driver. That shift away from paid channels helped bring sales & marketing spend down to 26% of revenue in Q1 2025, from 42% in 2022. Coupled with rising ARPAM, that suggests an improving LTV/CAC profile, especially as primary account relationships deepen.
🚀 Growth Drivers

Chime’s been running the interchange playbook with real discipline — but they’re not standing still. Under the hood, they’ve been expanding their product surface area, aiming to deepen relationships and expand monetization beyond swipe fees.
“Looking ahead, with less than five percent adoption in our core target market, we see an enormous opportunity to grow for years to come. Our primary account relationships uniquely position us to expand into adjacent service areas to enrich the lives of our members.”
-S1 Filing
TAM Expansion
🧱 1. ChimeCore — Owning the Infrastructure
In 2024, Chime launched ChimeCore, their proprietary payment processor and ledger. This isn’t just plumbing — it’s strategic:
Cost savings: Reduces reliance on third-party processors and gives them tighter control over margin
Speed: Enables faster product iteration and settlement flows
Control: Helps with fraud detection, risk modeling, and compliance agility
This is the same playbook big fintechs like Square and Stripe have run — own the rails to move faster and cheaper than the incumbents.
Chime recently rolled out Chime+, a free premium tier that unlocks:
Higher APY savings rates
Cashback deals (Chime Deals)
Enhanced support
It’s not monetized via subscription (yet), but it’s a retention and ARPAM play.
Incentivize direct deposit → unlock perks → deepen engagement.
It also plants a seed for future paid upgrades without violating their anti-fee brand ethos.
🏢 3. Chime Workplace — Going B2B(2C)
With Chime Workplace, they’re partnering directly with employers to offer financial wellness benefits: early wage access (MyPay), SpotMe, and savings tools for workers.
This is a distribution and stickiness move:
Employers get a lightweight benefit to offer workers
Chime gets embedded earlier in the paycheck lifecycle
It’s a wedge into verticalized fintech territory (think: Gusto, Even, Payactiv)
💸 4. The MyPay Tradeoff
MyPay has traction — $8.8B advanced since launch and now 12% of revenue — but the economics are tight. In Q1 2025:
Revenue: $64.3M
Credit Losses: $57.3M
Net: Just $7M
That expansion cost Chime 12 percentage points of transaction margin (79% → 67% YoY), and management warns margins may compress further as lending expands. It’s a classic fintech trade: sticky product, thin cushion. (See The Information for more MyPay analysis). The hope is they find their lending footing over time, reducing losses at scale as they hone in on the right customers to lend to.
💰 Valuation and Cap Table
Chime is taking the swipe-funded road to the public markets — but what’s the valuation story behind all that interchange?
📈 IPO Mechanics
Proposed Ticker: “CHME” on NYSE
Price Range: Not yet disclosed
Shares Outstanding Post-IPO: Not yet finalized
Last Private Valuation (2021): $25B, during a Series G led by Sequoia Capital
Bankers: Lead left = MS, then GS, then JPM to round out the top line
💰 Capitalization Snapshot
Chime exited Q1 2025 with $1.1B in cash and equivalents and minimal debt. They’ve reached positive net income, but adjusted EBITDA is still thin. The IPO proceeds are likely growth capital, not a lifeline — a strategic raise to fund expansion while preserving balance sheet flexibility. In CFO-speak: they don’t need the money, but they’re smart to take it now.
🧾 Cap Table Highlights
Principal stockholders include a who’s who of growth fintech capital:
Sequoia Capital – Led several rounds
SoftBank Vision Fund – Entered at Series G (they’ve been known to juice some valuations)
DST Global, General Atlantic, Tiger Global – Usual suspects in late-stage fintech
Founders: Chris Britt (CEO) and Ryan King (CTO) retain substantial equity and likely voting control via dual-class shares
Exact post-IPO ownership stakes are still redacted, but founder control is essentially guaranteed.
💵What’s It Worth?
Early media coverage floated a $30B IPO valuation, but that’s looking way less realistic. More recent whispers — and the actual math — suggest a tighter range under $10 billion.
Forward Valuation Math
If we assume conservative 20% growth in 2025, that puts revenue at ~$2.0B. At different valuation points:
$8B = 4x forward revenue
$9B = 4.5x
$12B = 6x
That implies Chime is lining up somewhere between Robinhood and Nubank — not priced like SaaS, but above typical lending or insurance models.
TL;DR: Not all fintech revenue is created equal. On the multiple ladder, interchange sits above float, lending, and insurance, but below SaaS, payments volume, AUM, and trading. Chime’s in the middle of the fintech pack — not a bank, not a Stripe.
For context:
Nubank trades at ~10–12x forward
Robinhood at ~5–6x
SoFi closer to 2–3x
Chime wants to pitch as a high-margin, low-capital consumer platform. But public investors will likely price them off recurring, swipe-based revenue — and build in a discount for regulatory exposure and lack of product diversification.
What’s on an Investor’s Mind?
1. Swipe or Die: Revenue Concentration
Chime earns ~ 90% of its revenue from interchange. That’s efficient — but fragile.
Regulatory risk: Any move to expand the Durbin Amendment or cap interchange fees would hit them directly.
Behavioral risk: Wallet rotation or spend slowdowns hurt more when swipes are your only engine.
Diversification gap: No lending, no float, no paid subs (yet).
📉 Investor concern: What happens if swipe economics compress? What’s Plan B?

2. Banking Without a Bank Charter
Chime isn’t a bank — it just plays one on your phone. All deposits and card issuance are handled by partner banks like Bancorp and Stride.
If one of those banks exits or BaaS regulation tightens, Chime’s core plumbing breaks.
Chime earns issuer economics, but it doesn’t control the rails.
🧨 Investor concern: This is platform risk, not just product risk.
3. Unit Economics Black Box
Chime’s S-1 is slick on ARPAM and user activity — but opaque on fundamentals.
No disclosed interchange take rate
No visibility into ChimeCore cost savings
No cohort-level LTV/CAC breakdown
🔍 Investor concern: Can’t model profitability per user? Can’t price the stock with confidence.
4. Margins Still Look Startup-ish (and Getting Squeezed)
Despite $1.67B in revenue, Chime posted just $13M in Q1 net income (2%) and 5% adj. EBITDA.
More telling: transaction margin dropped from 79% to 67% YoY, largely due to MyPay’s slim risk-adjusted returns.
💡 Investor concern: Is this margin profile sustainable, or just IPO window dressing?

5. Founder Control & Governance Risk
Chime is pursuing a dual-class structure, likely giving Britt and King long-term control.
That means limited shareholder recourse, even if performance lags.
Proxy advisors and governance-focused investors won’t love it.
👑 Investor concern: Founder-led forever — no matter what the scoreboard says.
6. Cap Table Shadows: Liquidity + Dilution
We don’t know how much secondary liquidity insiders took in that $25B Series G.
A likely option pool refresh could add dilution right out of the gate.
💸 Investor concern: Are new public shareholders signing up for growth — or for clean-up?

🧾 Final Word
Chime’s S-1 is more than a fintech filing — it’s a referendum on whether a consumer business can scale on trust, swipe economics, and software DNA alone. They aren’t trying to reinvent banking from the balance sheet up. They’re building a lightweight, front-end machine that runs on behavioral loyalty — and so far, the numbers say it works. But public markets are a different game. Interchange is a tightrope. And once you’re public, alignment gets stress-tested.
Investors will ask: is this a payments platform with SaaS margins, or a consumer app with swipe risk?
The answer will determine whether Chime becomes the Stripe of neobanks — or the Affirm of debit cards.
Enjoy this S1 breakdown? I do them every time a popular tech company files for an IPO. Please share with a friend.

Data source: Koyfin
TL;DR: Multiples are UP week-over-week.
Top 10 Medians:
EV / NTM Revenue = 14.8x (UP 0.3x w/w)
CAC Payback = 30 months
Rule of 40 = 50%
Revenue per Employee = $392k

Data source: Koyfin

Data source: Koyfin
Figures for each index are measured at the Median
Median and Top 10 Median are measured across the entire data set, where n = 111
Population Sizes:
Security: 18
Database and Infra: 14
Backoffice: 16
Marcom: 16
Marketplace: 15
Fintech: 16
Vertical SaaS: 16
Revenue Multiples
Revenue multiples are a shortcut to compare valuations across the technology landscape, where companies may not yet be profitable. The most standard timeframe for revenue multiple comparison is on a “Next Twelve Months” (NTM Revenue) basis.
NTM is a generous cut, as it gives a company “credit” for a full “rolling” future year. It also puts all companies on equal footing, regardless of their fiscal year end and quarterly seasonality.

Data source: Koyfin
However, not all technology sectors or monetization strategies receive the same “credit” on their forward revenue, which operators should be aware of when they create comp sets for their own companies. That is why I break them out as separate “indexes”.
Reasons may include:
Recurring mix of revenue
Stickiness of revenue
Average contract size
Cost of revenue delivery
Criticality of solution
Total Addressable Market potential
From a macro perspective, multiples trend higher in low interest environments, and vice versa.
Multiples shown are calculated by taking the Enterprise Value / NTM revenue.
Enterprise Value is calculated as: Market Capitalization + Total Debt - Cash
Market Cap fluctuates with share price day to day, while Total Debt and Cash are taken from the most recent quarterly financial statements available. That’s why we share this report each week - to keep up with changes in the stock market, and to update for quarterly earnings reports when they drop.
Historically, a 10x NTM Revenue multiple has been viewed as a “premium” valuation reserved for the best of the best companies.
Efficiency Benchmarks
Companies that can do more with less tend to earn higher valuations.

Data source: Koyfin
Three of the most common and consistently publicly available metrics to measure efficiency include:
CAC Payback Period: How many months does it take to recoup the cost of acquiring a customer?
CAC Payback Period is measured as Sales and Marketing costs divided by Revenue Additions, and adjusted by Gross Margin.
Here’s how I do it:
Sales and Marketing costs are measured on a TTM basis, but lagged by one quarter (so you skip a quarter, then sum the trailing four quarters of costs). This timeframe smooths for seasonality and recognizes the lead time required to generate pipeline.
Revenue is measured as the year-on-year change in the most recent quarter’s sales (so for Q2 of 2024 you’d subtract out Q2 of 2023’s revenue to get the increase), and then multiplied by four to arrive at an annualized revenue increase (e.g., ARR Additions).
Gross margin is taken as a % from the most recent quarter (e.g., 82%) to represent the current cost to serve a customer
Revenue per Employee: On a per head basis, how much in sales does the company generate each year? The rule of thumb is public companies should be doing north of $450k per employee at scale. This is simple division. And I believe it cuts through all the noise - there’s nowhere to hide.
Revenue per Employee is calculated as: (TTM Revenue / Total Current Employees)
Rule of 40: How does a company balance topline growth with bottom line efficiency? It’s the sum of the company’s revenue growth rate and EBITDA Margin. Netting the two should get you above 40 to pass the test.
Rule of 40 is calculated as: TTM Revenue Growth % + TTM Adjusted EBITDA Margin %
A few other notes on efficiency metrics:
Net Dollar Retention is another great measure of efficiency, but many companies have stopped quoting it as an exact number, choosing instead to disclose if it’s above or below a threshold once a year. It’s also uncommon for some types of companies, like marketplaces, to report it at all.
Most public companies don’t report net new ARR, and not all revenue is “recurring”, so I’m doing my best to approximate using changes in reported GAAP revenue. I admit this is a “stricter” view, as it is measuring change in net revenue.
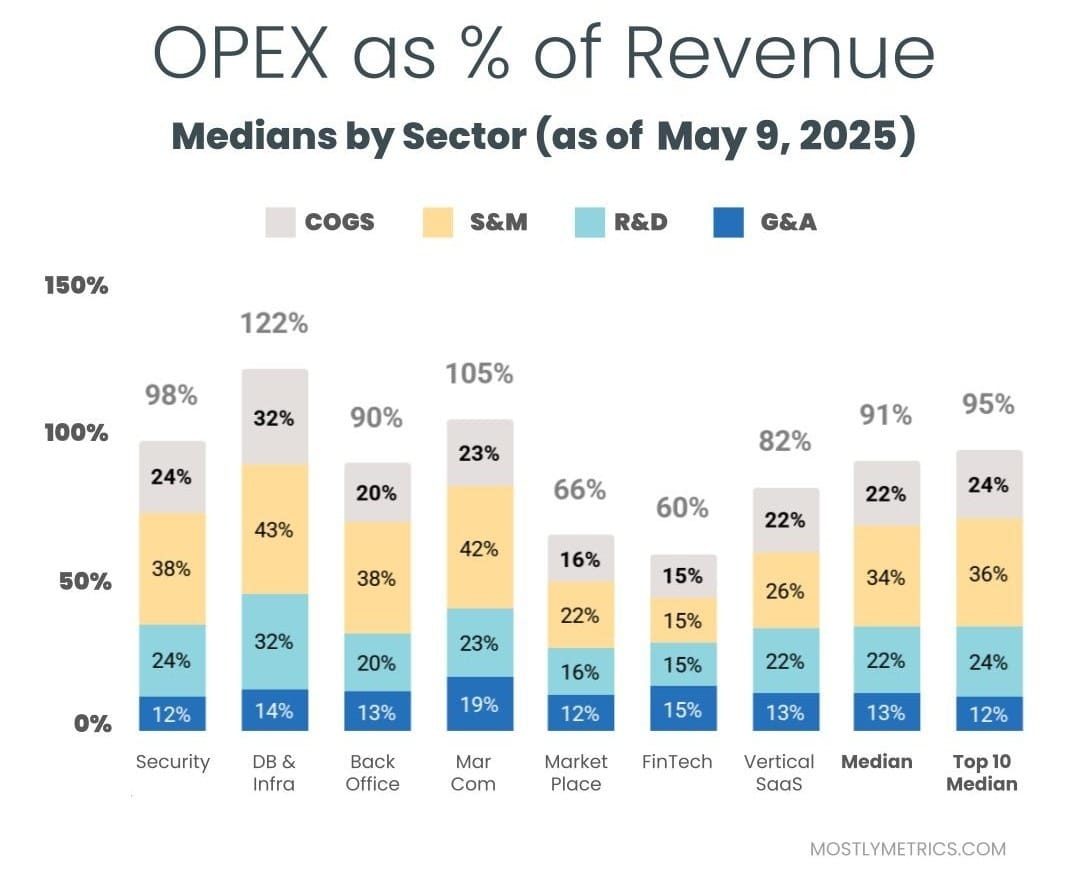
Operating Expenditures
Decreasing your OPEX relative to revenue demonstrates Operating Leverage, and leaves more dollars to drop to the bottom line, as companies strive to achieve +25% profitability at scale.

Data source: Koyfin
The most common buckets companies put their operating costs into are:
Cost of Goods Sold: Customer Support employees, infrastructure to host your business in the cloud, API tolls, and banking fees if you are a FinTech.
Sales & Marketing: Sales and Marketing employees, advertising spend, demand gen spend, events, conferences, tools.
Research & Development: Product and Engineering employees, development expenses, tools.
General & Administrative: Finance, HR, and IT employees… and everything else. Or as I like to call myself “Strategic Backoffice Overhead.”
All of these are taken on a Gaap basis and therefore INCLUDE stock based comp, a non cash expense.


