Mostly metrics

Investor, left, capital intensive AI startup, right

AI is everywhere—but is your team truly getting value? Planful’s 2025 Global Finance Survey uncovered that most teams are dabbling, not driving results. You’ve got a chance to lead smarter: automate what matters, tackle roadblocks like security and cost, and turn AI into ROI. The tools exist. The strategy? That’s where you come in.
Want to see what your peers are doing—and how to do it better?
Feature Story
AN UNHOLY ALLIANCE

This book slaps.
Most of you know me as a CFO who refuses to use a MacBook (since that’s how you go to jail), but I actually spent most of college studying American history.
I went to BC and wrote my senior thesis on the relationship between gangster Whitey Bulger and crooked FBI agent John Connolly. This was about a decade before Black Mass became a feature film starring Johnny Depp.
Hopefully I’m not spoiling anything here (I mean it’s history, like it happened, so if you get angry, IDK read a book), but the TL;DR is:
A mobster and an FBI agent grow up in the same Southie neighborhood.
As adults, they seemingly take opposite paths; one into law enforcement; one into organized crime.
But they form a marriage of convenience.
John wants a flashy informant to rise through the FBI.
Whitey wants to run his businesses without going to jail.
So why am I bringing this up?
Because my brother recently forwarded me The Information’s piece on Anthropic’s rumored fundraise and asked:
“Anthropic looking for $170B valuation on $5B ARR… Do you think these valuations are fair? Or is it hard to even say because of the unprecedented growth in a new category?”
This is fresh off Anthropic raising $3.5 billion in March at a $58 billion pre-money valuation, led by Lightspeed Venture Partners and joined by MGX.
That’s a steep markup. But their revenue is also up 500%… from $1B to $5B… in just a few quarters.
From a technical valuation perspective, you say, well I have the sticker price. Now I need to estimate how fast they will grow over the next twelve months. If they are going to explode from $5B to $15B (300% growth), that’s only a 11x forward revenue multiple. Not crazy at all.
For context, DataDog and Snowflake do between $3B and $4B in revenue, are growing in the 20%’s, and trade at around 13x forward revenue.
(Profitability police: They also have something called free cash flows… again, somewhere in the 20%s)
Even if Anthropic goes from $5B to $10B (100% y/y growth), that’s about a 17x forward revenue multiple, which could very much be substantiated in the public markets given their growth profile at scale.
Because, again, it’s really hard to grow that fast when you are already that big.
But here’s the bigger takeaway:
This isn’t just about valuation math. It’s about an unholy alliance between two forces that need each other—massive capital piles and foundational model companies that can actually absorb that capital.

Might start selling MM tinfoil financial analyst hats.
My friend Kyle Harrison calls companies like this “Hungry Hippos.” And the incentives are stacked for the relationship to thrive:
From the LP side: If it’s going to be a binary outcome, the opportunity cost is simply too great to not participate. Investors will be v. grumpy if they miss out, as they can theoretically gain to infinity, and can factually lose to zero.
From the GP side: Even if it turns out to be a merely “good” investment instead of a legendary one, that 2% management fee on a $3B fund still means $60M a year. That’s a pretty nice consolation prize.
So investors need to find companies that can absorb billions. And guess what? Anthropic is one of the few capable of actually spending that much money—fast.
And you are playing the investing game for management fees, you found your investment market fit with LLMs. 2% times an incredibly large number is a big number.
Which brings us back to the Whitey and Connolly analogy. It’s a marriage of convenience. Both sides need each other to get what they want. Both sides are incentivized to keep the game going.
As Kyle put it:
“You have an unstoppable force of reality-altering AI, and an immovable object of capital agglomeration screaming toward each other. Candidly, I think they’re a match made in heaven—and they’re going to shape the world.”
Incentives drive outcomes. And today, nothing drives incentives harder than the need to run up the tab.

TL;DR: Multiples are FLAT week-over-week.
Top 10 Medians:
EV / NTM Revenue = 16.2x (UP 0.1x w/w)
CAC Payback = 21 months
Rule of 40 = 50%
Revenue per Employee = $463k
Figures for each index are measured at the Median
Median and Top 10 Median are measured across the entire data set, where n = 143
Population Sizes:
Security & Identity = 17
Data Infrastructure & Dev Tools = 13
Cloud Platforms & Infra = 15
Horizontal SaaS & Back office = 19
GTM (MarTech & SalesTech) = 19
Marketplaces & Consumer Platforms = 18
FinTech & Payments = 24
Vertical SaaS = 18
Revenue Multiples
Revenue multiples are a shortcut to compare valuations across the technology landscape, where companies may not yet be profitable. The most standard timeframe for revenue multiple comparison is on a “Next Twelve Months” (NTM Revenue) basis.
NTM is a generous cut, as it gives a company “credit” for a full “rolling” future year. It also puts all companies on equal footing, regardless of their fiscal year end and quarterly seasonality.
However, not all technology sectors or monetization strategies receive the same “credit” on their forward revenue, which operators should be aware of when they create comp sets for their own companies. That is why I break them out as separate “indexes”.
Reasons may include:
Recurring mix of revenue
Stickiness of revenue
Average contract size
Cost of revenue delivery
Criticality of solution
Total Addressable Market potential
From a macro perspective, multiples trend higher in low interest environments, and vice versa.
Multiples shown are calculated by taking the Enterprise Value / NTM revenue.
Enterprise Value is calculated as: Market Capitalization + Total Debt - Cash
Market Cap fluctuates with share price day to day, while Total Debt and Cash are taken from the most recent quarterly financial statements available. That’s why we share this report each week - to keep up with changes in the stock market, and to update for quarterly earnings reports when they drop.
Historically, a 10x NTM Revenue multiple has been viewed as a “premium” valuation reserved for the best of the best companies.
Efficiency
Companies that can do more with less tend to earn higher valuations.
Three of the most common and consistently publicly available metrics to measure efficiency include:
CAC Payback Period: How many months does it take to recoup the cost of acquiring a customer?
CAC Payback Period is measured as Sales and Marketing costs divided by Revenue Additions, and adjusted by Gross Margin.
Here’s how I do it:
Sales and Marketing costs are measured on a TTM basis, but lagged by one quarter (so you skip a quarter, then sum the trailing four quarters of costs). This timeframe smooths for seasonality and recognizes the lead time required to generate pipeline.
Revenue is measured as the year-on-year change in the most recent quarter’s sales (so for Q2 of 2024 you’d subtract out Q2 of 2023’s revenue to get the increase), and then multiplied by four to arrive at an annualized revenue increase (e.g., ARR Additions).
Gross margin is taken as a % from the most recent quarter (e.g., 82%) to represent the current cost to serve a customer
Revenue per Employee: On a per head basis, how much in sales does the company generate each year? The rule of thumb is public companies should be doing north of $450k per employee at scale. This is simple division. And I believe it cuts through all the noise - there’s nowhere to hide.
Revenue per Employee is calculated as: (TTM Revenue / Total Current Employees)
Rule of 40: How does a company balance topline growth with bottom line efficiency? It’s the sum of the company’s revenue growth rate and EBITDA Margin. Netting the two should get you above 40 to pass the test.
Rule of 40 is calculated as: TTM Revenue Growth % + TTM Adjusted EBITDA Margin %
A few other notes on efficiency metrics:
Net Dollar Retention is another great measure of efficiency, but many companies have stopped quoting it as an exact number, choosing instead to disclose if it’s above or below a threshold once a year. It’s also uncommon for some types of companies, like marketplaces, to report it at all.
Most public companies don’t report net new ARR, and not all revenue is “recurring”, so I’m doing my best to approximate using changes in reported GAAP revenue. I admit this is a “stricter” view, as it is measuring change in net revenue.
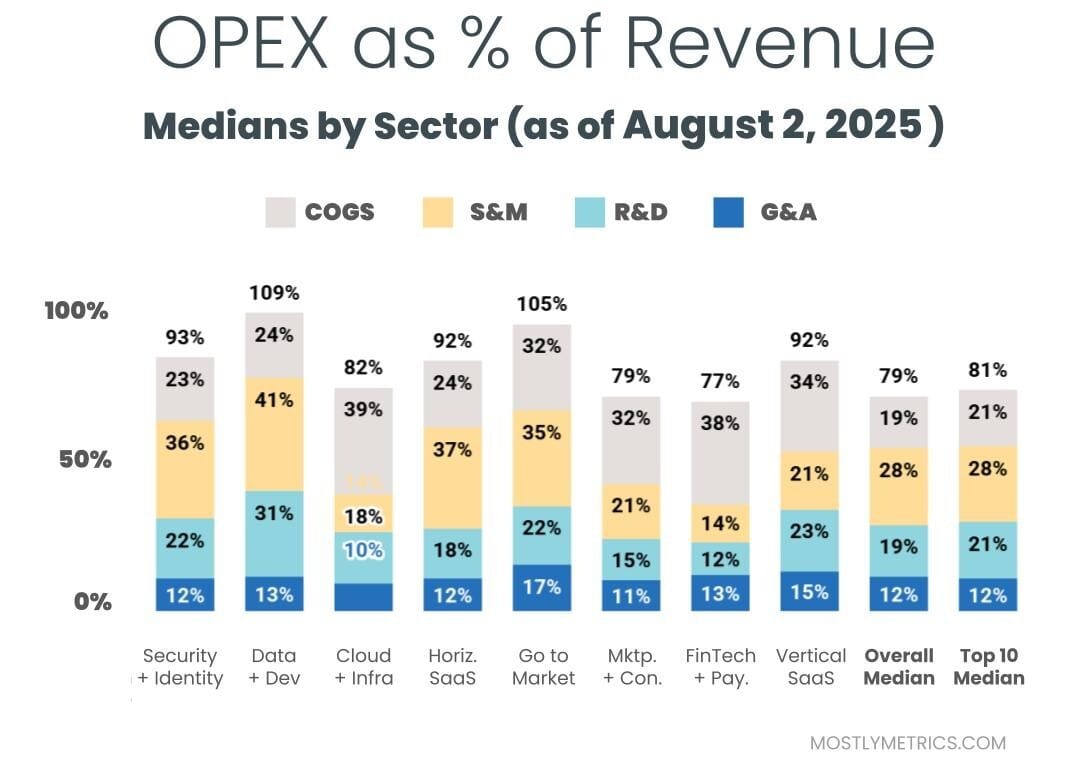
OPEX
Decreasing your OPEX relative to revenue demonstrates Operating Leverage, and leaves more dollars to drop to the bottom line, as companies strive to achieve +25% profitability at scale.
The most common buckets companies put their operating costs into are:
Cost of Goods Sold: Customer Support employees, infrastructure to host your business in the cloud, API tolls, and banking fees if you are a FinTech.
Sales & Marketing: Sales and Marketing employees, advertising spend, demand gen spend, events, conferences, tools.
Research & Development: Product and Engineering employees, development expenses, tools.
General & Administrative: Finance, HR, and IT employees… and everything else. Or as I like to call myself “Strategic Backoffice Overhead.”
All of these are taken on a Gaap basis and therefore INCLUDE stock based comp, a non cash expense.
Please check out our data partner, Koyfin. It’s dope.
Hoping your ARR bridge ties.
CJ


