👋 Hi, it’s CJ Gustafson and welcome to Mostly Metrics, my weekly newsletter where I unpack how the world’s best CFOs and business experts use metrics to make better decisions.

Stubhub IPO: S1 Breakdown

Gross Transaction Value (GTV): $8.68B (+27% YoY)
Revenue: $1.77B (+29% YoY)
Take Rate: 20.4% (up slightly YoY)
Gross Margin: 69% GAAP / 81% adjusted
Adj. EBITDA: $299M (17% margin, -16% YoY)
Free Cash Flow: $255M (14% margin, -16% YoY)
StubHub’s ~20% take rate isn’t just a grab for margin — it bundles in buyer and seller fees, payment processing, and fulfillment. That makes it one of the most premium-priced consumer marketplaces, and it wears that badge with pride.
This isn’t a post-COVID sugar high either. StubHub is showing scaled, sustainable growth. Revenue is growing faster than GTV, FCF is tracking close to EBITDA, and any margin compression is from reinvestment, not operational rot.
Importantly, this is a marketplace with real unit economics. Unlike others still dependent on VC subsidies to bait users with discounts, StubHub’s value prop isn’t cheap tickets — it’s a curated, reliable experience for limited-supply events. You’re not bargain-hunting here like you are with rideshares or food delivery. You’re securing access.
Other Callouts:
Transactions per Buyer: 1.6
Average Order Value: ~$250
Active Buyers: 30M+
StubHub isn’t just converting intent — it’s monetizing repeat behavior. The flywheel’s spinning, and users keep coming back. Speaking of that…
Business Model

StubHub is a classic two-sided marketplace. Sellers list tickets. Buyers search, click, and purchase. StubHub charges both sides a fee — without ever holding inventory. Not a bad place to be.
How they make money:
Buyer Fees: 10–15%
Seller Fees: 5–10%
Blended Take Rate (2024): 20.4%
It’s a scalable model: no inventory risk, low capex, high margin. And as more buyers show up, more sellers follow — reinforcing liquidity, selection, and pricing transparency.
Marketplace Mechanics:

Search & Discovery: Buyers can filter by seat, row, section, and event. StubHub’s algorithms surface listings optimized for conversion — not just price.
Pricing Leverage: StubHub doesn’t set prices — but it thrives in moments of scarcity. Big events → higher demand → higher AOV → more fee dollars.
Fulfillment & Trust: StubHub manages ticket delivery, guarantees the purchase, and handles support. Operationally complex, but essential for trust.
Why It Works:
Brand Trust: Still the default resale platform in the U.S.
Liquidity: 30M+ active buyers = sellers can move inventory fast.
Global Reach: Active in 100+ countries with meaningful cross-border capabilities.
StubHub isn’t Craigslist for concerts — it’s a full-stack platform with discovery, fulfillment, and monetization built in. That’s how it supports premium fees and strong margins.
Go-To-Market
Stubhub’s GTM is built on brand, buyer urgency, and SEO muscle.
StubHub’s growth engine isn’t outbound sales — it’s intent capture. The company wins by being the default destination when someone types “Taylor Swift tickets” into Google.
Growth Channels:
SEO: High-intent, evergreen keywords = free demand.
Paid Marketing: Mostly Google + retargeting = high ROI per click.
Partnerships: With teams, artists, and venues = inventory access + trust.
StubHub doesn’t need to sell tickets — it just needs to be there when the buyer’s ready.
Market Opportunity
A global, recurring spend category with secular tailwinds.
Live Events TAM (2027 est.): $78B
North America Secondary Market (2024): $18B
International Resale Opportunity: $23B
StubHub's Stated SAM: $194B
StubHub's Stated TAM (including adjacents): $726B
Tailwinds:
Experiences > Stuff: Younger consumers are spending more on live events vs. physical goods. This is structural.
Dynamic Pricing Arbitrage: StubHub helps the market reprice undervalued primary inventory — and takes a fee on the spread.
Global Fandom: StubHub’s cross-border capabilities let it monetize Messi in Miami and K-pop in Korea.
It’s a massive category that’s becoming more digital, global, and monetizable — StubHub is built for that shift.
Financial Profile
A high-margin marketplace that’s throwing off cash.

StubHub’s not a growth-at-all-costs story. It’s a mature, asset-light business with real margins and real cash flow.

Revenue (2024): $1.77B
Gross Profit (Adjusted): $1.43B (81% margin)
Adj. EBITDA: $299M
Free Cash Flow: $255M
Cash: $762M
Net Debt: ~$738M
Leverage: ~2.1x Debt/EBITDA
Despite modest EBITDA compression, StubHub scaled revenue while remaining profitable — a sign the unit economics are working.


Benchmarking Stubhub


StubHub doesn’t have Etsy’s vertical or Airbnb’s brand halo — but it holds its own on margins and beats peers like Eventbrite on scale and monetization.
(SeatGeek numbers are estimates based on publicly available information)
12 Key Themes Driving the StubHub IPO
1. Recurring Transaction Flow at Scale
StubHub processes tens of millions of high-intent transactions every year. This isn’t episodic revenue — it’s habitual behavior built on emotional urgency.
2. Take Rate Durability Reflects Platform Control
Fees on both sides, fulfillment included — and buyers keep paying. That’s pricing power + brand trust. Despite being the “middleman”, they really control the transaction.
3. Rule of +43 Company
14% FCF margin on $1.77B in revenue. Rare air for consumer marketplaces.
Paired with 29% revenue growth.
Even stronger “Rule Of” if you’re one of those psychos who uses EBITDA % instead of FCF % (I’ll die on this hill).
4. Repositioning Toward Primary and International Expansion
Going upstream to own ticket issuance. Risky, but could unlock new margin layers.
5. StubHub is a Yield Optimizer, Not a Price Setter
Like an exchange, it routes demand to maximize velocity and take — without inventory risk.
6. Conversion Is the Metric That Matters Most
With perishable inventory, velocity matters more than visits. StubHub wins on sell-through.
Not to state the obvious - but a ticket to Taylor Swift the next day is worth $0.
7. Pricing Power Embedded in the Emotional Purchase
Identity, nostalgia, status. Buying a ticket isn’t rational — it’s personal.
8. Event Discovery as a Lead Gen Loop
StubHub isn’t just checkout — it’s discovery. That top-of-funnel power matters.
9. Compounding First-Party Data Across Cohorts
They know who you are, what you like, and when you buy — and they use it. Their user graph is extremely valuable, and leads to compounding knowledge at the point of purchase.
10. Operational Leverage in Support, Not Just Infra
Fraud, fulfillment, and CS scale better than you think. SG&A flattens with volume.
11. Strategic Optionality with Payment Flows
Future upside in seller payouts, buyer financing, FX plays. Monetization layers are latent. Everyone wants to be a fintech. Stubhub could actually do it.
12. Defensible Against Disintermediation — for Now
Teams may want to go direct, but they can’t match buyer liquidity. Yet.
Potential Red Flags
1. Founder Control via Dual-Class Shares
Eric Baker holds super-voting Class B shares. Institutional investors may squirm.
StubHub paid Baker’s other company ~$1.6M in 2023 for ticket inventory. Disclosed, but not ideal optics.
3. Historical “Put Right” Liabilities
StubHub let employees sell back equity pre-IPO. The structure created complexity and temporary balance sheet noise.
Valuation Scenarios
Let’s assume StubHub is targeting somewhere between $8B and $10B in enterprise value at IPO. If we assume they grow 25% next year (a decrease of ~5% y/y), that would imply ~$2.2B in revenue and a 3.5x to 4.5x NTM revenue multiple. That’s pretty reasonable given their revenue growth and profitability.
These multiples would place StubHub above Uber and Cargurus but below Doordash, Airbnb, and Zillow.
Bull Case: GTV hits $10B+ in 2025, international expands, optionality gets credit
Bear Case: Market views category as discretionary, compresses multiples
StubHub isn’t a high-growth SaaS play — but it could earn premium marketplace comps if the Street buys the margin story.

TL;DR — StubHub’s IPO Is a Bet on Experience-Driven Liquidity
StubHub is what happens when a platform captures both demand and emotion. It doesn’t create events — it monetizes access to them. And it’s been doing that, at scale, across categories, for over 20 years.
The question isn’t whether it’s a good business — it is. The question is whether investors believe that brand + trust + conversion = durable cash flows in a fee-sensitive world.
This IPO won’t trade on hype. It’ll trade on execution. The biggest questions are:
Can StubHub grow beyond secondary into primary ticketing?
Will international markets follow the same liquidity curve?
And can it maintain platform trust as it scales?
In short: StubHub has a lot going for it. But to earn a growth multiple, it’ll need to prove it’s more than just the place people go after a show sells out — it needs to become the default layer for live event commerce, period.
None of this is investment advice. I edit this while watching Ms. Rachel.


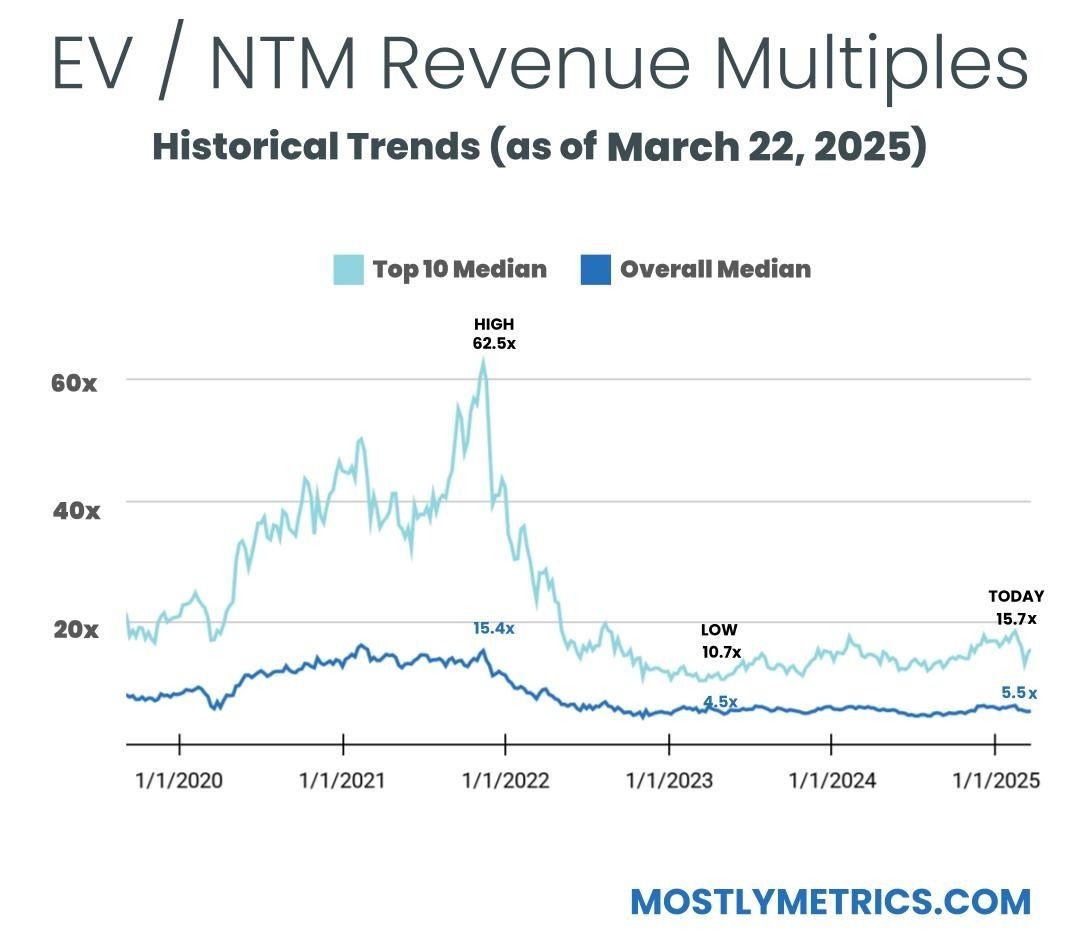
TL;DR: Multiples are UP week-over-week.
Top 10 Medians:
EV / NTM Revenue = 15.7x (UP 0.8x w/w)
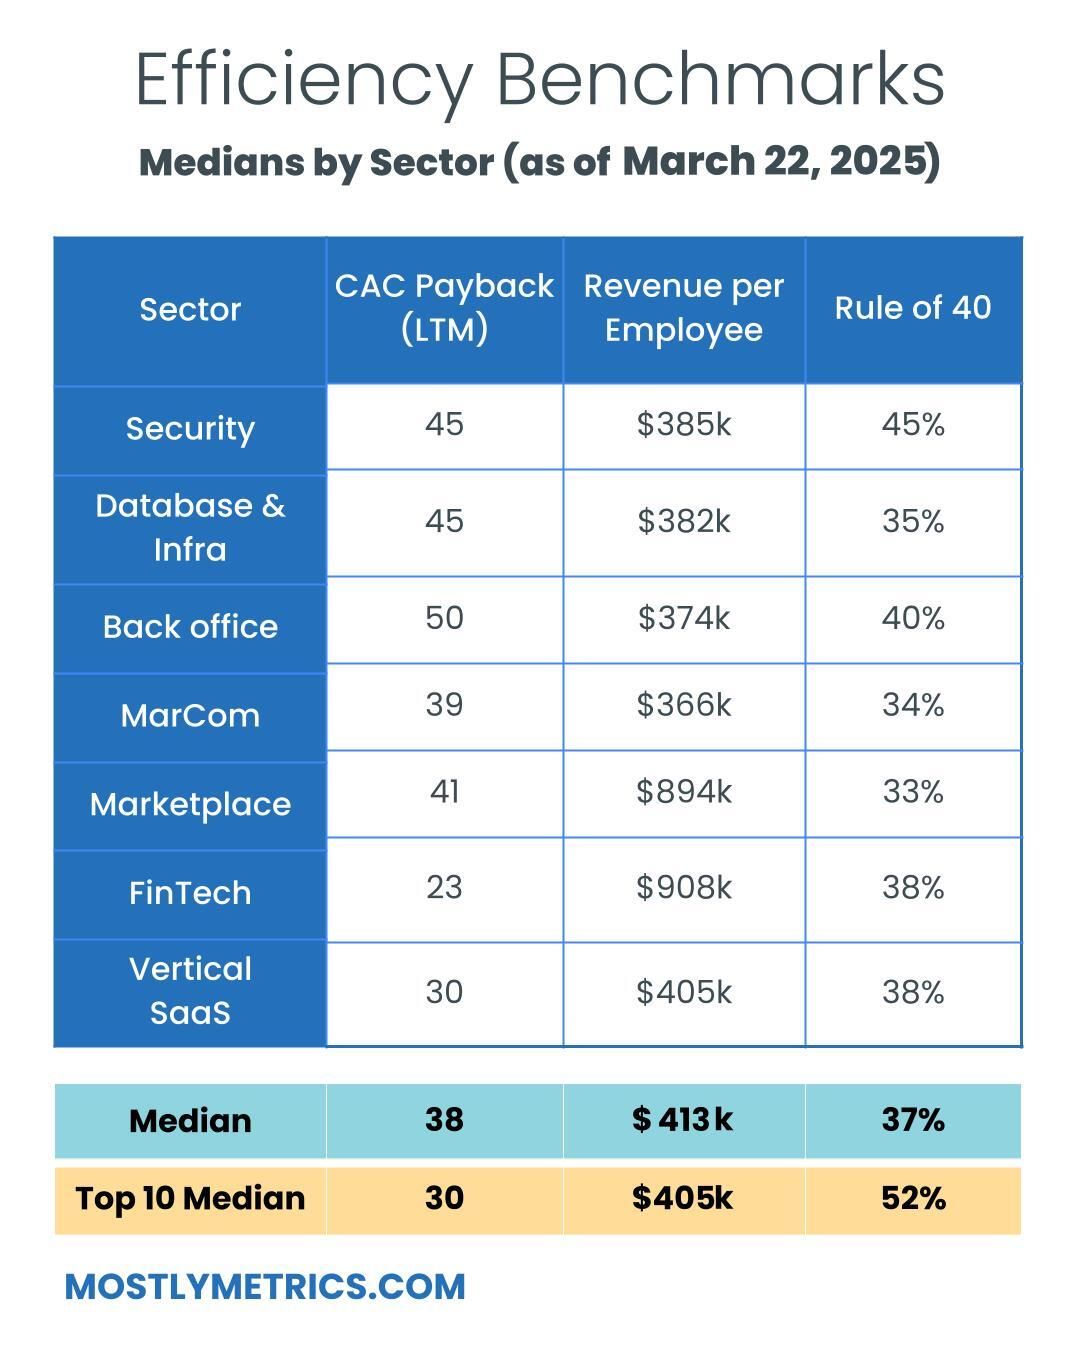
CAC Payback = 30 months
Rule of 40 = 52%
Revenue per Employee = $405k

Figures for each index are measured at the Median
Median and Top 10 Median are measured across the entire data set, where n = 109
Population Sizes:
Security: 18
Database and Infra: 13
Backoffice: 16
Marcom: 16
Marketplace: 15
Fintech: 16
Vertical SaaS: 16
Revenue Multiples
Revenue multiples are a shortcut to compare valuations across the technology landscape, where companies may not yet be profitable. The most standard timeframe for revenue multiple comparison is on a “Next Twelve Months” (NTM Revenue) basis.
NTM is a generous cut, as it gives a company “credit” for a full “rolling” future year. It also puts all companies on equal footing, regardless of their fiscal year end and quarterly seasonality.

However, not all technology sectors or monetization strategies receive the same “credit” on their forward revenue, which operators should be aware of when they create comp sets for their own companies. That is why I break them out as separate “indexes”.
Reasons may include:
Recurring mix of revenue
Stickiness of revenue
Average contract size
Cost of revenue delivery
Criticality of solution
Total Addressable Market potential
From a macro perspective, multiples trend higher in low interest environments, and vice versa.
Multiples shown are calculated by taking the Enterprise Value / NTM revenue.
Enterprise Value is calculated as: Market Capitalization + Total Debt - Cash
Market Cap fluctuates with share price day to day, while Total Debt and Cash are taken from the most recent quarterly financial statements available. That’s why we share this report each week - to keep up with changes in the stock market, and to update for quarterly earnings reports when they drop.
Historically, a 10x NTM Revenue multiple has been viewed as a “premium” valuation reserved for the best of the best companies.
Efficiency Benchmarks
Companies that can do more with less tend to earn higher valuations.

Three of the most common and consistently publicly available metrics to measure efficiency include:
CAC Payback Period: How many months does it take to recoup the cost of acquiring a customer?
CAC Payback Period is measured as Sales and Marketing costs divided by Revenue Additions, and adjusted by Gross Margin.
Here’s how I do it:
Revenue per Employee: On a per head basis, how much in sales does the company generate each year? The rule of thumb is public companies should be doing north of $450k per employee at scale. This is simple division. And I believe it cuts through all the noise - there’s nowhere to hide.
Revenue per Employee is calculated as: (TTM Revenue / Total Current Employees)
Rule of 40: How does a company balance topline growth with bottom line efficiency? It’s the sum of the company’s revenue growth rate and EBITDA Margin. Netting the two should get you above 40 to pass the test.
Rule of 40 is calculated as: TTM Revenue Growth % + TTM Adjusted EBITDA Margin %
A few other notes on efficiency metrics:
Net Dollar Retention is another great measure of efficiency, but many companies have stopped quoting it as an exact number, choosing instead to disclose if it’s above or below a threshold once a year. It’s also uncommon for some types of companies, like marketplaces, to report it at all.
Most public companies don’t report net new ARR, and not all revenue is “recurring”, so I’m doing my best to approximate using changes in reported GAAP revenue. I admit this is a “stricter” view, as it is measuring change in net revenue.
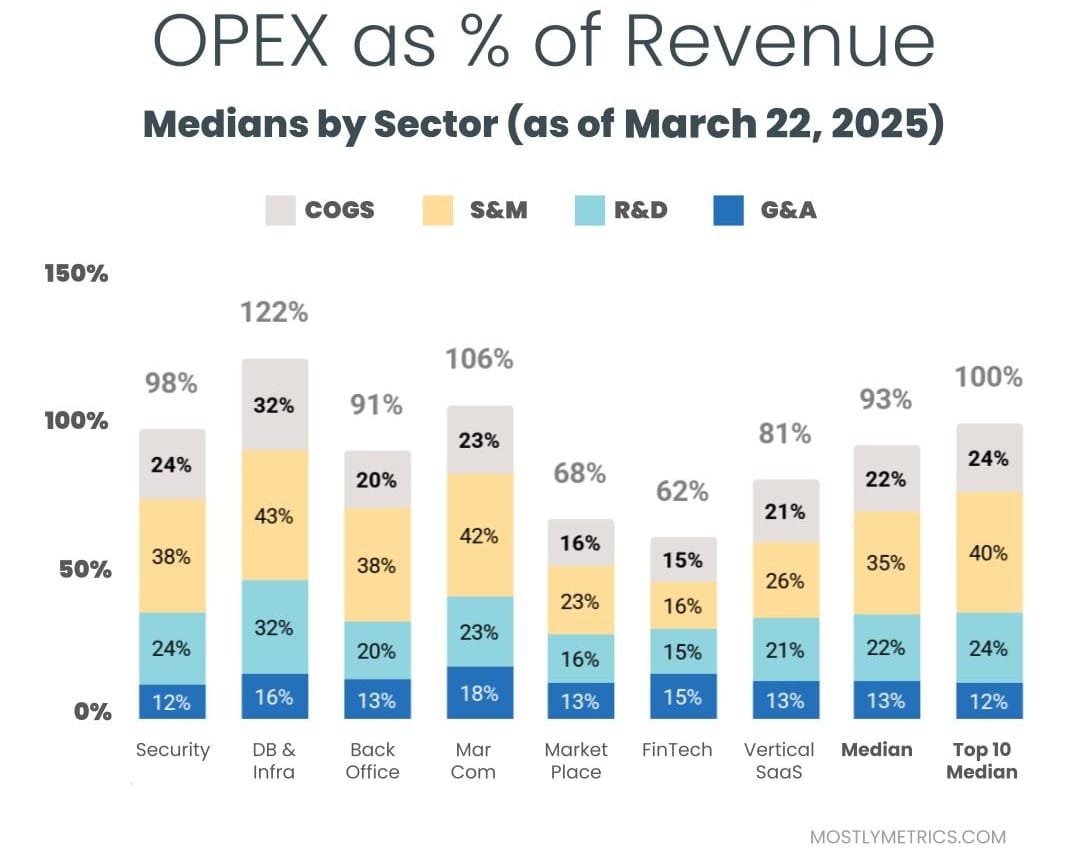
Operating Expenditures
Decreasing your OPEX relative to revenue demonstrates Operating Leverage, and leaves more dollars to drop to the bottom line, as companies strive to achieve +25% profitability at scale.

The most common buckets companies put their operating costs into are:
Cost of Goods Sold: Customer Support employees, infrastructure to host your business in the cloud, API tolls, and banking fees if you are a FinTech.
Sales & Marketing: Sales and Marketing employees, advertising spend, demand gen spend, events, conferences, tools.
Research & Development: Product and Engineering employees, development expenses, tools.
General & Administrative: Finance, HR, and IT employees… and everything else. Or as I like to call myself “Strategic Backoffice Overhead.”
All of these are taken on a Gaap basis and therefore INCLUDE stock based comp, a non cash expense.
